Author Archives: maksimrudnev

Rudnev, M., & Vauclair, C. M. (2022).  Revisiting Cowgill’s Modernisation Theory: Perceived Social Status of Older Adults Across 58 Countries.  Ageing & Societyhttps://doi.org/10.1017/S0144686X22001192
Full text

Abstract

Cowgill’s modernisation theory stipulates that older people’s social status is lower in societies with higher societal modernisation. The few existing studies reveal conflicting results showing either negative or positive associations. The current study follows up seminal cross-national research on the perceived social status of people in their seventies (PSS70) in a diverse set of countries. PSS70 was defined as the relative status of people in their seventies compared to people in their forties. Data were obtained by the World Values Survey (2010–2014) and included 78,904 respondents from 58 countries. Multilevel regressions showed that the level of modernisation had a strong and negative association with the PSS70 but mostly due to one component, namely the share of older people in society. The associations were more complex when considering cultural zones of which two stood out. Irrespective of level of modernisation, Muslim countries showed higher and post-communist countries showed lower levels of PSS70. In Muslim countries, modernisation had a near-zero association with PSS70, whereas it was strongly negatively associated with PSS70 in post-communist countries. This study generally supports Cowgill’s theory in a large and diverse cross-sectional sample of countries, yet it also illustrates its cultural boundary conditions.

Alignment method for measurement invariance: Tutorial

It’s been a while since measurement invariance alignment has been introduced in 2014, but not that many researchers applied it in practice. Among ~200 citations (as of May 2019) of the original alignment paper there were only a few substantive applications. It is a pity because you can always enjoy more optimistic results with alignment as compared to the conventional (frequentist, exact) measurement invariance techniques. I guess, it’s been happening due to statistical complexity and a lack of simple guidelines. In this post I summarized, in an approachable way, the steps that are necessary to apply alignment procedure. In addition, I provide couple of  R functions which automate preparation of Mplus code and extraction of useful information from the outputs.

Updates:

[August 23, 2023]: Please note this tutorial was based on Mplus version 7.3. Since then, Mplus developed many new features related to alignment and even introduced a new alignment-inspired class of models called penalized SEM.
[February 26, 2022]: Some minor errors were fixed.
[November 13, 2020]: The post was updated to make it fully reproducible.

Contents

Intro
Step 1. Find an acceptable configural invariance model
Step 2. Set up “FREE” alignment model in Mplus
Step 3. Set up “FIXED” alignment model
Step 4. Interpret the “Approximate measurement invariance” output
Step 5. Interpret “FACTOR MEAN COMPARISON” output
Step 6. Interpret “ALIGNMENT OUTPUT” output
Step 7. Checking the reliability of the results with simulation
Example Mplus files
Additional options (Bayesian estimation, estimation fine tuning,  extra mean ranking table, fit function contribution, categorical indicators)
Software, including automation in R
Resources

Continue reading

In defense of cross-sectional studies

Peter Molenaar’s widely cited paper and a recent Fisher et al. (2018) claim that between-individual differences that are often used to explain within-individual processes cannot be used for this purpose, or at least may invoke a large bias. In some students and researchers, this article created a false impression that between-individual (or cross-sectional) studies are totally useless in arguing about within-individual processes. In this post, I claim that cross-sectional studies aren’t useless and sometimes are the only possible way to find out about within-individual processes.

Imagine a person who has been raised religious, always goes to church every Sunday, and prays every day before sleep. Imagine also that this particular person is also strongly against abortion. A typical longitudinal study would measure her religiosity and her attitudes toward abortion multiple times during, say, five years, and then test if there is a correlation between change in a level of religiosity and change in a level of the attitude. If the person’s religiosity hasn’t changed, the classic longitudinal study would efficiently estimate zero relations between these variables because one of them is constant. The fact that religiosity has been constantly high for five years by no means implies it doesn’t influence attitudes. My point is that the longitudinal study might detect relations between variables that change, and totally useless when it faces no within-individual change. Therefore, within-individual designs aren’t almighty in discovering within-individual processes. In my example, a between-individual design is the only way to find out about what might be going on within an individual. We would see that more religious individuals are less in favor of abortions, and may theorize that a constantly high level of religiosity leads to a constantly negative attitude to abortion.

Following Judea Pearl, in order to make a valid conclusion, we have to overcome a mere observation of associations (which he treats as a lowest level of inference). To be able to make valid inferences,  we have to imagine and reason the counterfactuals, i.e. the events that have not happened.  In my example, the person’s low level of religiosity is counterfactual, but we can infer what would happen if it were the case – and the only way to do this is to use cross-sectional, between-individual data.
As I noticed above, within-individual designs are limited to features that change. My guess is that more stable features of person and personality (such as values, personality traits, gender, social class) tend to affect behavior and attitudes in much much higher degree than characteristics that change. Indeed, important things don’t change fast, that’s why they are important! Therefore, between-individual studies might well be even more powerful than within-individual studies in discovering and explaining within-individual processes.

These limitations of within-individual designs apply to surveys as well as to experiments; additional limitation of experiments is that we cannot manipulate most of things, and those we actually can aren’t very powerful forces.

Of course, we have to have in mind that between-individual designs describe first of all between-individual differences, and only with some serious assumptions (which we have to explicate and reflect on) they may suggest a course of within-individual processes. The main assumption here is that a sample of individuals represents a sample of states of a single individual.  Whether this assumption is reasonable or not is subject to discuss, but we shouldn’t blindly deny the use of cross-sectional designs in studying within-person processes. It might be a substantively driven decision in studies of within-person processes, going beyond organizational concerns.

 

Schwartz circle in ggplot2

Since 2008 I draw Schwartz value theory in a form of circle unaccountable number of times, and there were very different versions, with more or fewer circles inside, in different languages and with different emphases. I used PowerPoint, Word, Excel, Paint, even Photoshop once. Here is not the optimal but quite universal and customizable solution.
UPD. Now it’s a function schwartz_circle() in my R package LittleHelpers.
Continue reading

Branching pipes

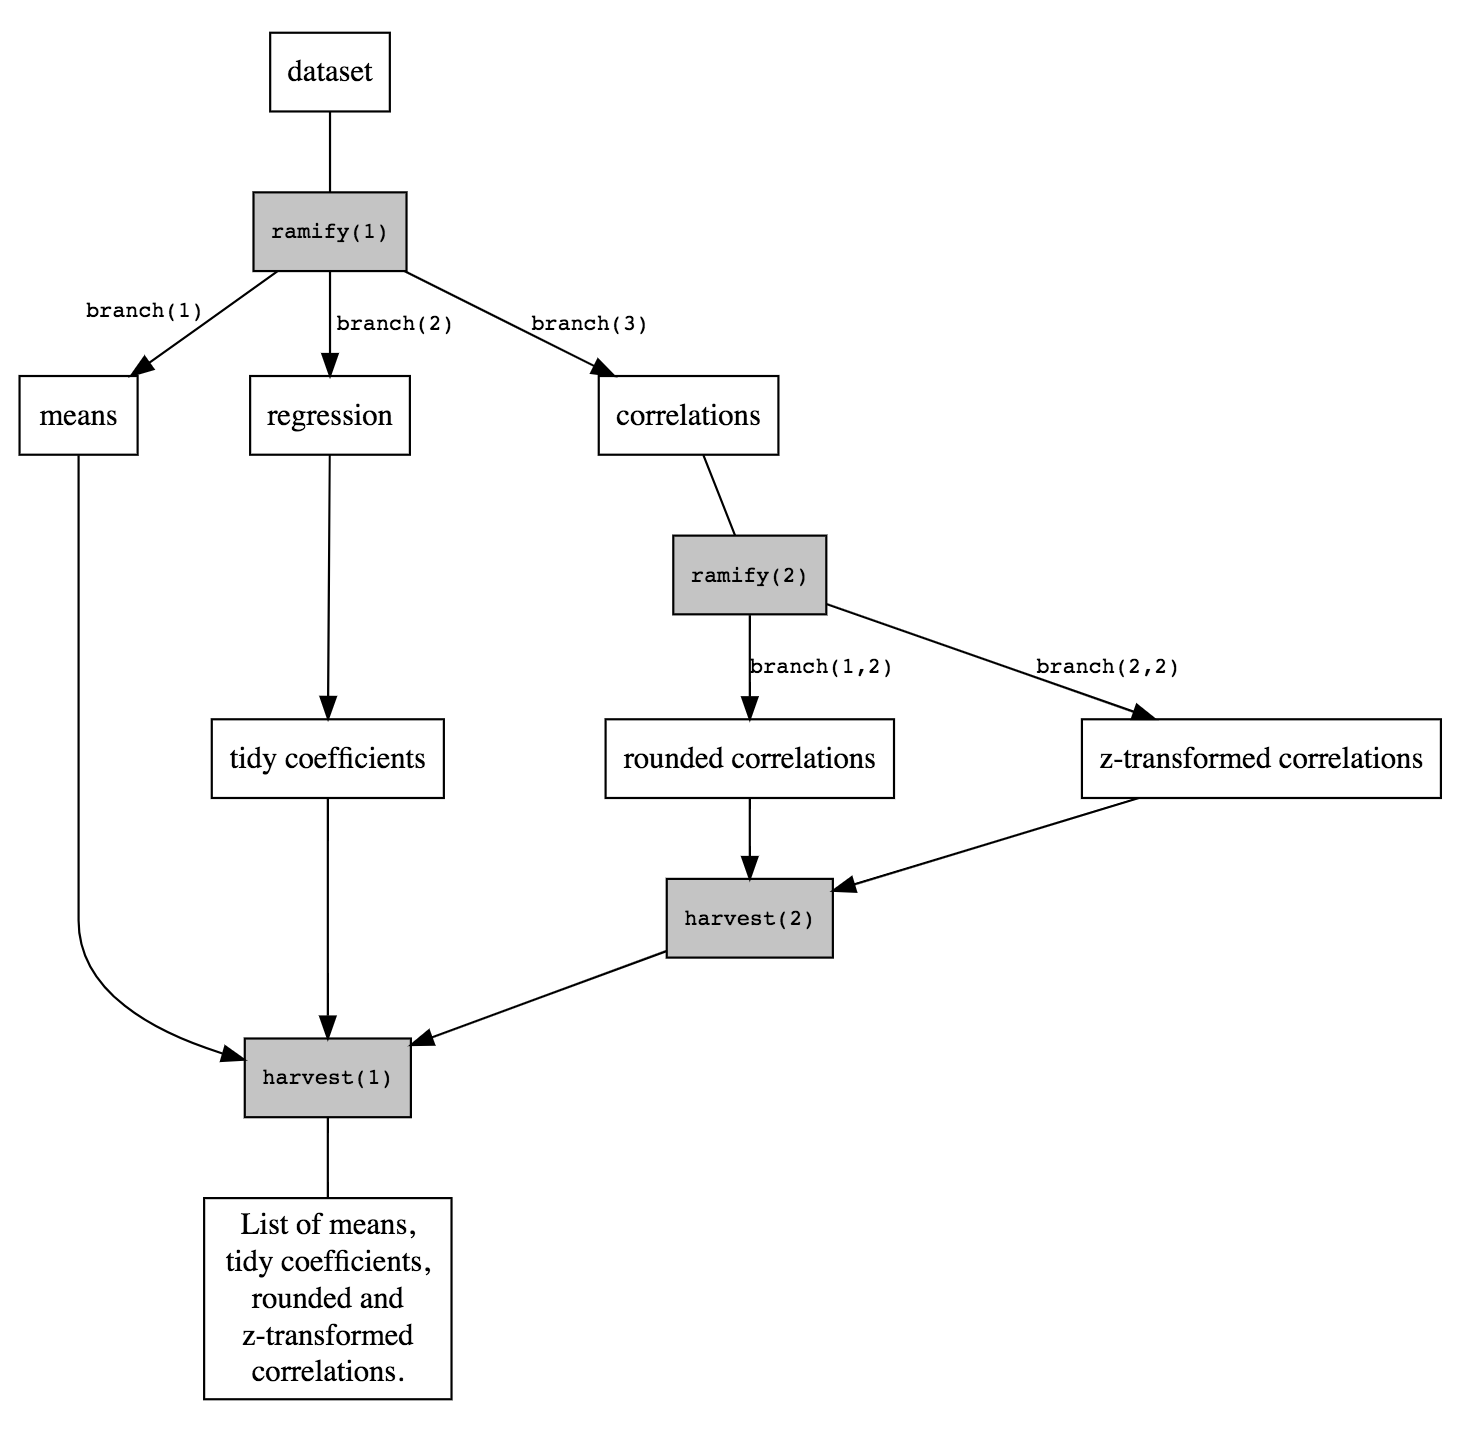
Here are three little functions that allow for brunching logical pipes as defined in magrittr package. It is against Hadley’s idea, as pipes are in principle linear, and in general I agree, but sometimes it would be comfy to ramify pipes away. It overcomes native magrittr %T>% by allowing more than one step after cutting the pipe.
Imagine you need to create a list with means, correlations, and regression results. And you like to do it in one single pipe. In general, it is not possible, and you’ll have to start a second pipe, probably doing some redundant computations.
Here is an example that allows it:

data.frame(a=1:5, b=1/(1+exp(6:10)) ) %>%
  ramify(1) %>%
    branch(1) %>% colMeans %>%
    branch(2) %>% lm(a ~ b, .) %>% broom::tidy(.) %>%
    branch(3) %>% cor %>%
      ramify(2) %>%
        branch(1) %>% round(2) %>%
        branch(2) %>% psych::fisherz(.) %>%
      harvest(2) %>%
  harvest
  • ramify() – Saves current result into temporary object .buf and identifies a point in the pipe where branching will happen. Argument is an id of ramification.
  • branch() – Starts a new brunch from the ramify point. (brunch(1) can be omitted, as ramify creates the first brunch. Second argument is a family of branches, or parent branch. By default it uses the last parent branch created by last used ramify​.
  • harvest() – Returns contents of all the brunches as a list and clears the buffer.

BRANCH

See proof of concept https://gist.github.com/MaksimRudnev/bf81eab9f39bd830f9f167c669444472


“Pipes are fundamentally linear and expressing complex relationships with them will typically yield confusing code.”
 http://r4ds.had.co.nz/pipes.html#when-not-to-use-the-pipe


‘n’go

savengo is ridiculously simple but potentially useful function that saves objects from a middle of your pipe and passes the same object to further elements of the pipe. It allows more efficient debugging and less confusing code, in which you don’t have to interrupt your pipe every time you need to save an output.
Its sister function appendngo appends an intermediary product to an existing list or a vector.
By analogy, one can create whatever storing function they need.

# Example 1
#Saves intermediary result to an object named intermediate.result
final.result <- dt %>% dplyr::filter(score<.5) %>%
                        savengo("intermediate.result") %>%
                        dplyr::filter(estimated<0)
# Example 2
#Saves intermediary result as a first element of existing list
final.result <- dt %>% dplyr::filter(score<.5) %>%
                        appendngo(myExistingList, after=0) %>%
                        dplyr::filter(estimated<0)

See proof of concept https://gist.github.com/MaksimRudnev/bf81eab9f39bd830f9f167c669444472

Little function to download ESS data on the go

Motivation

Yes, there is a recently published brand new R package ess for downloading European social survey data, I tried it, although at this point it is quite limited.
What are the good sides of ess package?

  • it downloads data, sometimes several data at a time

What’s not so good?

  • when it downloads several rounds, you get a list of data instead of integrated dataset;
  • it can only download one country data at a time;
  • it tuned up for use in Stata, but not in R, for example, I couldn’t see most of the value labels.

So, I thought it would be useful to have a customizable function (instead of package) to do the same thing, but better. For example, you can keep labels to use, for example, with my label_book.

Details

Don’t put more than one country or more than one round – it won’t work. For countries, use iso2c codes, or “all”. This function will expire when ESS updates its data versions, but it happens about twice a year, and can be fixed manually.

Examples

#1. Source the function
eval(parse(text =getURL("https://raw.githubusercontent.com/MaksimRudnev/LittleHelpers/master/download_ess/download_ess.R")))
#2. Enjoy it
ESS2 <- download_ess(round=2, country="all", "mymail@gmail.com") #Add your registered on ESS website mail here
ESS6.Russia <- download_ess(round=6, country="RU", "mymail@gmail.com")

Function itself

Continue reading

Label book for R

Sometimes, when you explore a new dataset, variable names don’t make much sense. In SPSS you would just look at the labels, in R it’s not that straightforward: checking codebooks all the time is tedious, reading a questionnaire and trying to guess which variable corresponds to each question is even less reliable. If your data has labels as attributes, or you have read .sav datafile into R with haven or foreign package, it would be handy to have a searchable table of all the variable and value labels in the dataset. I looked it up and didn’t find such a function, so I have written a little simple function myself.
 
UPD. Now this function is a part of my R package LittleHelpers.
Continue reading

Explore values in Europe with Shiny App

After I have conducted the same kind of descriptive statistics for the thousandth time I realized the world needs a simple tool to explore value levels across years and countries.
The tool is purely exploratory, don’t forget about comparability and measurement invariance problems. My website is hosted by WordPress which sucks in embedding stuff, so you have to click the link:
http://apps.maksimrudnev.com:3838/shiny_values/
There are three tabs to explore trends by country, which allows comparison of value trends within each country, by value – to compare countries, and value map to see all the countries as points in the space of two higher order value dimensions. Point you mouse at country point on the value map to see how they moved during the measurement period.
Below are some screenshots.
Screen Shot 2017-08-07 at 10.05.36 Continue reading

Conflict of interest in social science

There is one great thing about medical and epidemiological research – declaration of the conflicts of interest.  Medical researchers, usually before they actually present any research results, declare that they are not biased by financing or obligations to pharmaceutical companies, to producers of devices, commercially promoted ways of treatment, or anything like this.
However, social scientists do not bother with such nuance. Not-so-smart ones would claim they try to be objective. Smart ones would say: “Of course we’re biased”, but would never reflect in their articles in which way (and editors would not accept such papers). Given the neo-positivist ethos of the leading journals in sociology and social psychology, conflict of interest  (or researcher’s personal bias) can undermine many conclusions without even acknowledging it. Especially when a researcher has so many degrees of freedom. It looks totally outdated, as if we haven’t had all these anti- and post-positivisms, or critical theory.  Haven’t every reader thought about comparing consistent results of some prominent scholars of, for example, values and moral attitudes with their personal views? We can try to avoid this bias statistically, but we cannot easily reshape the way we think, so the least we can do is a declaration of researcher’s personal opinions added to every article. Of course, this is a very personal stuff, but I think it would greatly amend a positivist pathos of many, many articles.