Since 2008 I draw Schwartz value theory in a form of circle unaccountable number of times, and there were very different versions, with more or fewer circles inside, in different languages and with different emphases. I used PowerPoint, Word, Excel, Paint, even Photoshop once. Here is not the optimal but quite universal and customizable solution.
UPD. Now it’s a function schwartz_circle() in my R package LittleHelpers.
Continue reading
Category Archives: r
Branching pipes
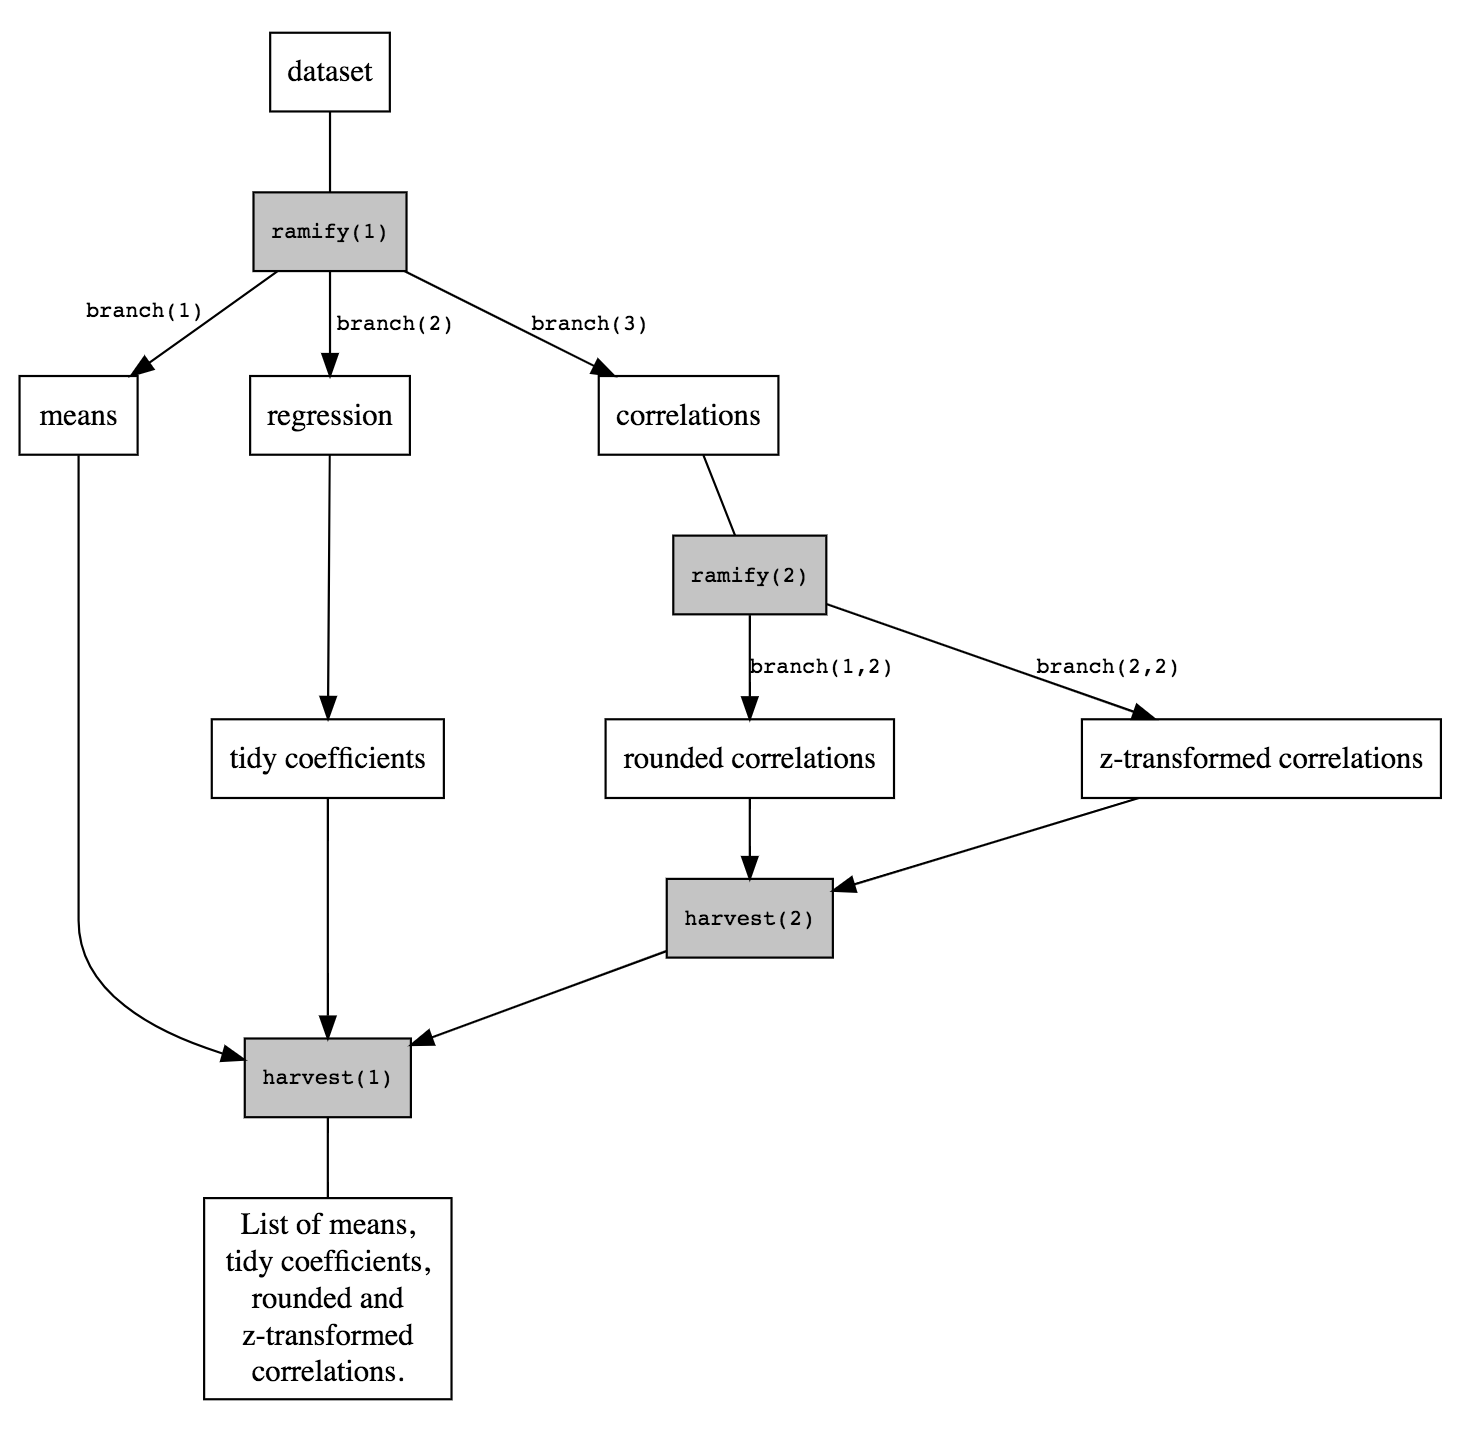
Here are three little functions that allow for brunching logical pipes as defined in magrittr package. It is against Hadley’s idea, as pipes are in principle linear, and in general I agree, but sometimes it would be comfy to ramify pipes away. It overcomes native magrittr %T>% by allowing more than one step after cutting the pipe.
Imagine you need to create a list with means, correlations, and regression results. And you like to do it in one single pipe. In general, it is not possible, and you’ll have to start a second pipe, probably doing some redundant computations.
Here is an example that allows it:
data.frame(a=1:5, b=1/(1+exp(6:10)) ) %>%
  ramify(1) %>%
    branch(1) %>% colMeans %>%
    branch(2) %>% lm(a ~ b, .) %>% broom::tidy(.) %>%
    branch(3) %>% cor %>%
      ramify(2) %>%
        branch(1) %>% round(2) %>%
        branch(2) %>% psych::fisherz(.) %>%
      harvest(2) %>%
  harvest
ramify()– Saves current result into temporary object.bufand identifies a point in the pipe where branching will happen. Argument is an id of ramification.branch()– Starts a new brunch from theramifypoint. (brunch(1) can be omitted, as ramify creates the first brunch. Second argument is a family of branches, or parent branch. By default it uses the last parent branch created by last usedramify.harvest()– Returns contents of all the brunches as a list and clears the buffer.
See proof of concept https://gist.github.com/MaksimRudnev/bf81eab9f39bd830f9f167c669444472
“Pipes are fundamentally linear and expressing complex relationships with them will typically yield confusing code.”
http://r4ds.had.co.nz/pipes.html#when-not-to-use-the-pipe
‘n’go
Leave a reply
savengo is ridiculously simple but potentially useful function that saves objects from a middle of your pipe and passes the same object to further elements of the pipe. It allows more efficient debugging and less confusing code, in which you don’t have to interrupt your pipe every time you need to save an output.
Its sister function appendngo appends an intermediary product to an existing list or a vector.
By analogy, one can create whatever storing function they need.
# Example 1
#Saves intermediary result to an object named intermediate.result
final.result <- dt %>% dplyr::filter(score<.5) %>%
                        savengo("intermediate.result") %>%
                        dplyr::filter(estimated<0)
# Example 2
#Saves intermediary result as a first element of existing list
final.result <- dt %>% dplyr::filter(score<.5) %>%
                        appendngo(myExistingList, after=0) %>%
                        dplyr::filter(estimated<0)
See proof of concept https://gist.github.com/MaksimRudnev/bf81eab9f39bd830f9f167c669444472
Little function to download ESS data on the go
Motivation
Yes, there is a recently published brand new R package ess for downloading European social survey data, I tried it, although at this point it is quite limited.
What are the good sides of ess package?
- it downloads data, sometimes several data at a time
What’s not so good?
- when it downloads several rounds, you get a list of data instead of integrated dataset;
- it can only download one country data at a time;
- it tuned up for use in Stata, but not in R, for example, I couldn’t see most of the value labels.
So, I thought it would be useful to have a customizable function (instead of package) to do the same thing, but better. For example, you can keep labels to use, for example, with my label_book.
Details
Don’t put more than one country or more than one round – it won’t work. For countries, use iso2c codes, or “all”. This function will expire when ESS updates its data versions, but it happens about twice a year, and can be fixed manually.
Examples
#1. Source the function
eval(parse(text =getURL("https://raw.githubusercontent.com/MaksimRudnev/LittleHelpers/master/download_ess/download_ess.R")))
#2. Enjoy it
ESS2 <- download_ess(round=2, country="all", "mymail@gmail.com") #Add your registered on ESS website mail here
ESS6.Russia <- download_ess(round=6, country="RU", "mymail@gmail.com")
Function itself
Label book for R
Sometimes, when you explore a new dataset, variable names don’t make much sense. In SPSS you would just look at the labels, in R it’s not that straightforward: checking codebooks all the time is tedious, reading a questionnaire and trying to guess which variable corresponds to each question is even less reliable. If your data has labels as attributes, or you have read .sav datafile into R with haven or foreign package, it would be handy to have a searchable table of all the variable and value labels in the dataset. I looked it up and didn’t find such a function, so I have written a little simple function myself.
UPD. Now this function is a part of my R package LittleHelpers.
Continue reading
Explore values in Europe with Shiny App
After I have conducted the same kind of descriptive statistics for the thousandth time I realized the world needs a simple tool to explore value levels across years and countries.
The tool is purely exploratory, don’t forget about comparability and measurement invariance problems. My website is hosted by WordPress which sucks in embedding stuff, so you have to click the link:
http://apps.maksimrudnev.com:3838/shiny_values/
There are three tabs to explore trends by country, which allows comparison of value trends within each country, by value – to compare countries, and value map to see all the countries as points in the space of two higher order value dimensions. Point you mouse at country point on the value map to see how they moved during the measurement period.
Below are some screenshots.
 Continue reading
Social networks data collection tools
Collecting social networks data with R is highly beneficial since it can update results/graphs/reports on the air.
Here are the basic ones:
All of them are based on the functions provided by httr or RCurl and work mostly using GET and POST web requests dealing directly with a corresponding network’s API. This is not too hard to develop your own tool for your specialized purposes, it will only take some time to get acquainted with specifics of your network’s API (which is usually quite simple). There are tools that integrate these packages with graphing and network analysis tools, such as SocialMediaLab.