Practical session 2. Regressions and stats
31/01/2019
1 Q & A
What are the problems with the previous assignment? Anything not very clear?
2 Projects in Rstudio
Rstudio -> File -> New project …
Projects save the workspace and set working directory. You can work with several R scripts at the same time.
3 👉 Problem set
Using data ESS8PT.sav, answer the following questions:
- What is the mean satisfaction of life (variable
stflife) in Portugal? Is it significantly different from the middle of the scale, 5? - Does life satisfaction significantly correlate with subjective health (variable
health)? - Does life satisfaction significantly differ across genders (variable
gndr)? - Does life satisfaction significantly differ across types of settlement (
domicil)? - What are independent effects of gender, age (
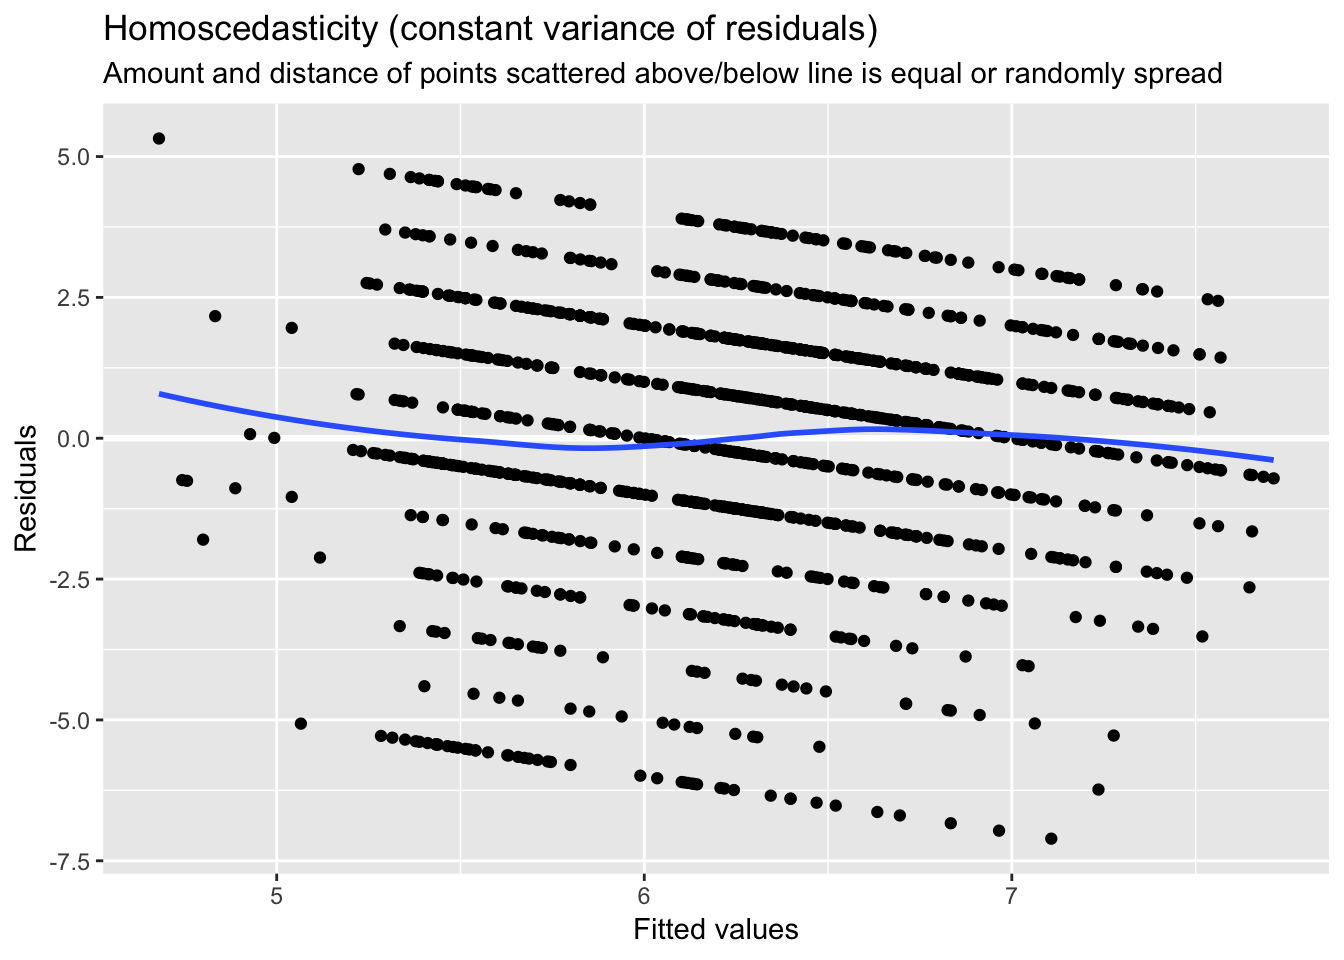
agea), and type of settlement (domicil)? Build a regression model; check if all the variables have appropriate class (“numeric”, “factor”).- Is there multicollinearity or heteroscedasticity?
- What is a predictive power of this model?
- What is the impact of every year of age into life satisfaction?
- Is there a quadratic (U-curve) effect of age?
- Does effect of age differs across genders? (add an interaction term).
- Summarize these three models (initial, with squared age, and with interaction) in a single table. Did other coefficients or their significance changed.
Try to write a single R script that works smoothly from the beginning to the end.
4 ⭕️ Bonus: graphical presentation of regressions
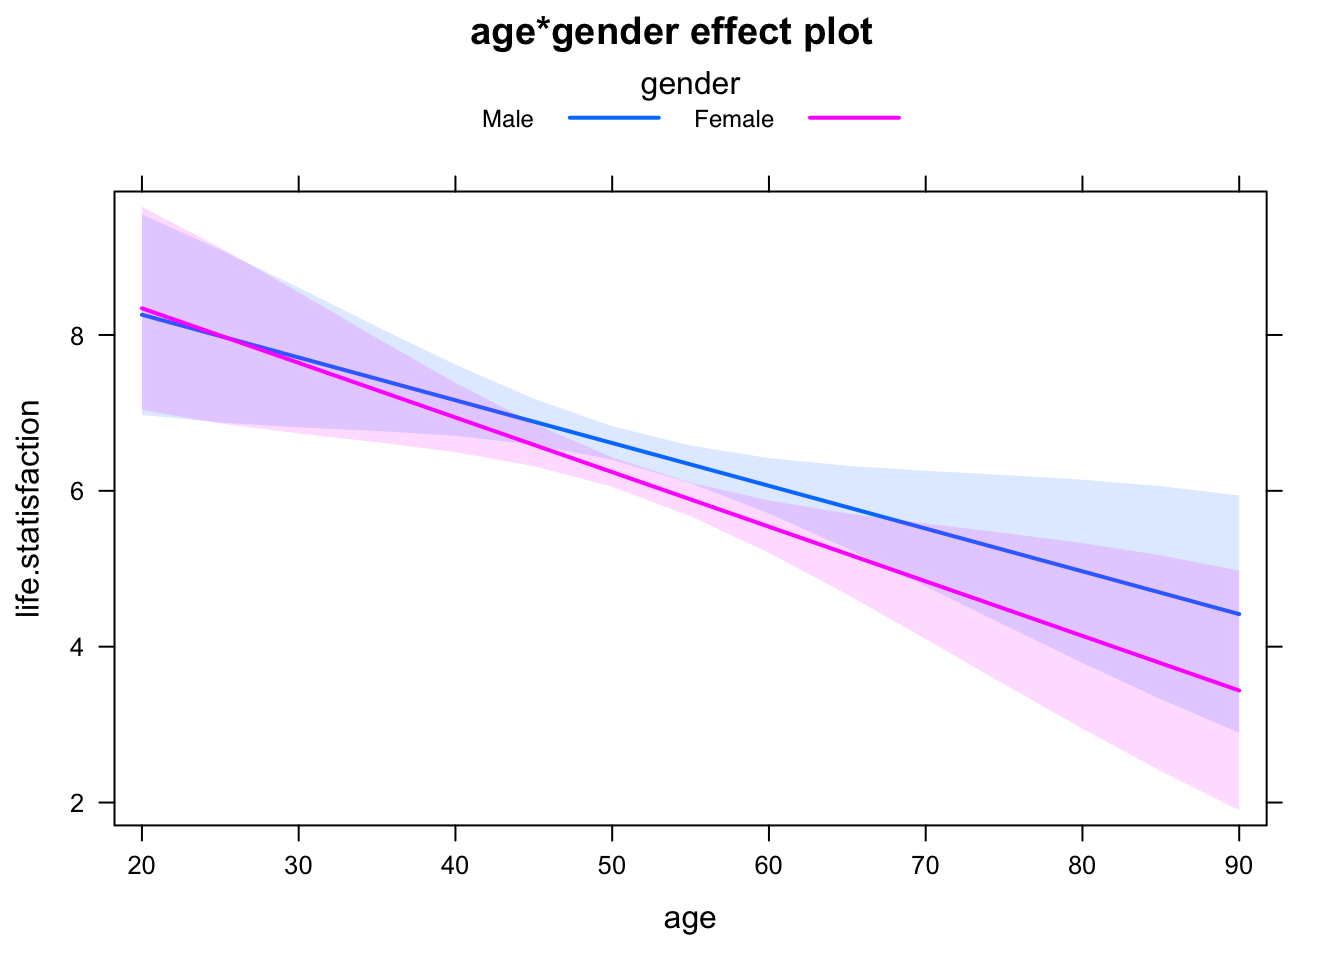
4.1 effects
library(effects)

eff <- effect(term = c("age*gender"), # the term to plot
              mod  = m1,              # fitted model
              se   = TRUE             # compute standard errors?
              )


plot(x = eff,                      # computed predicted  values
     multiline = TRUE,             # put several lines at the single plot?
     confint=list(style="bands"),  # ribbons (bands) or "lines", or "bars"?
     rug = FALSE                   # plot density by rug bars?
     )
4.2 sjPlot
library("sjPlot")

# Just coefficients with confidence intervals
plot_model(m1, type = "est") 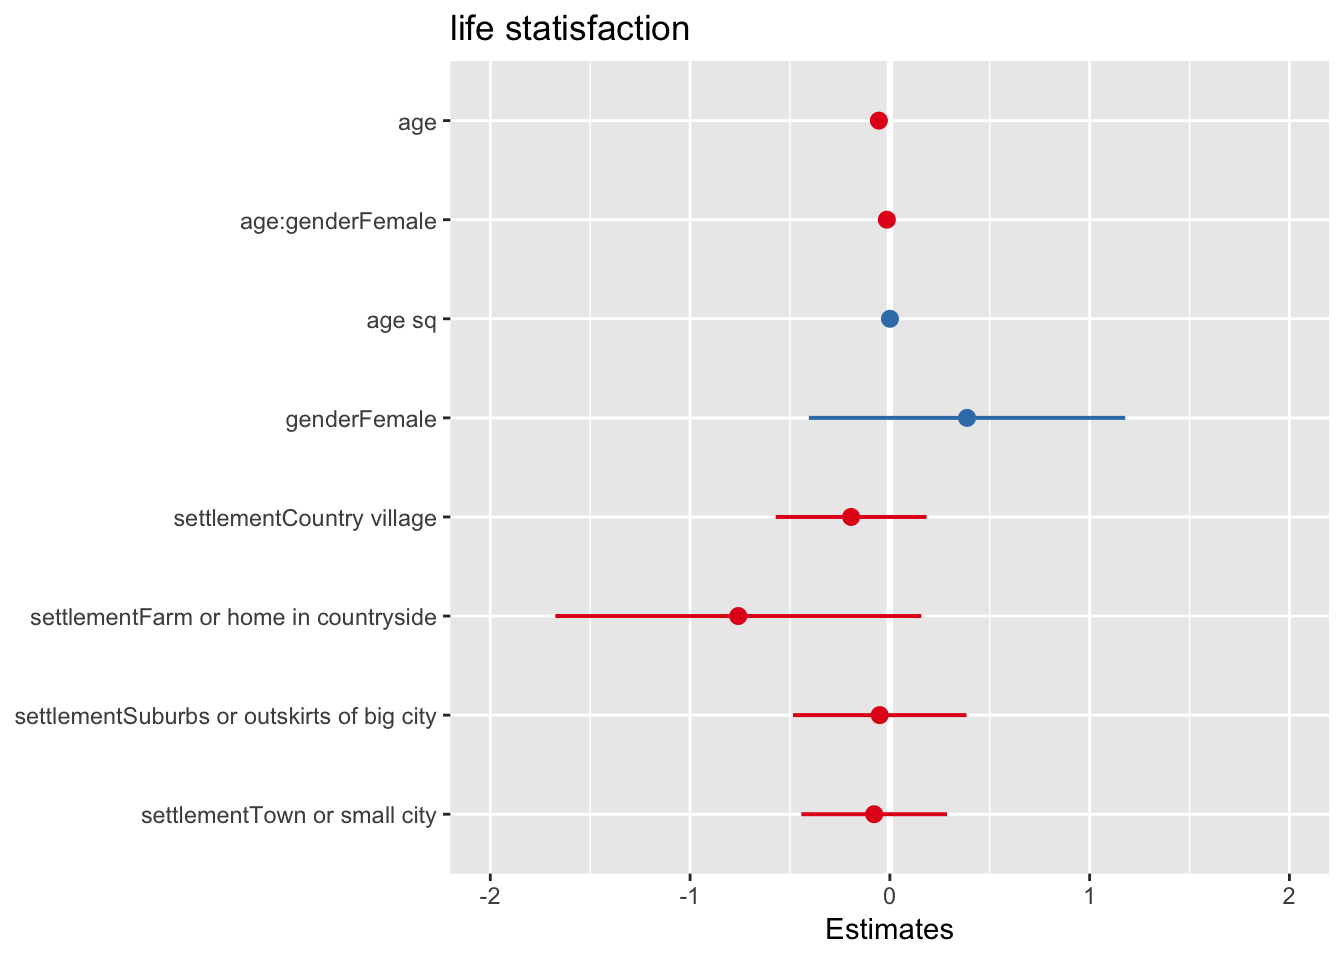
# Interaction terms' slopes
plot_model(m1, type = "int")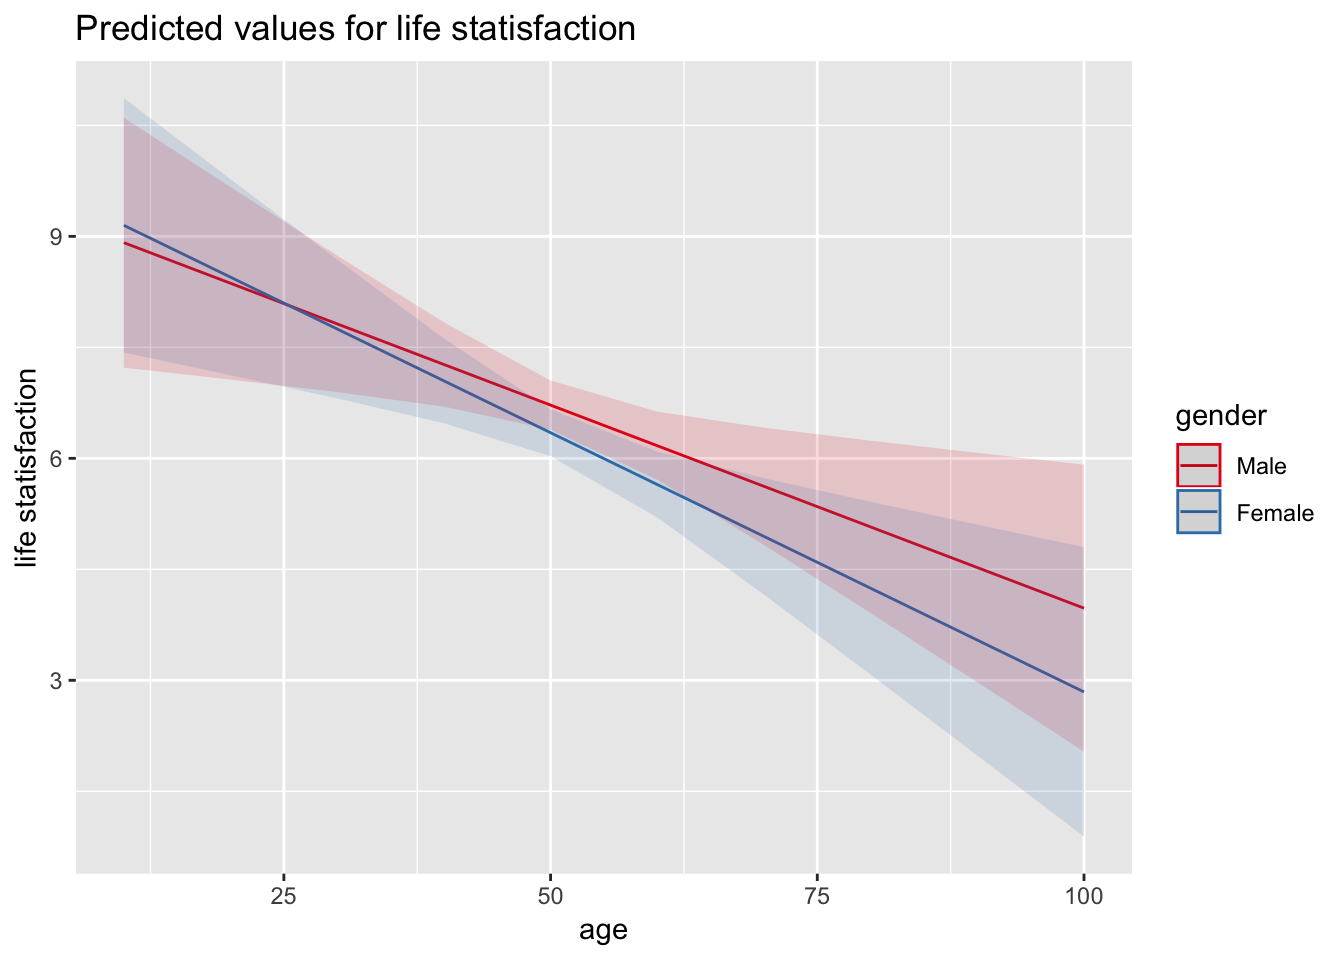
# Regression diagnostic plots
plot_model(m1, type = "diag")
## [[1]]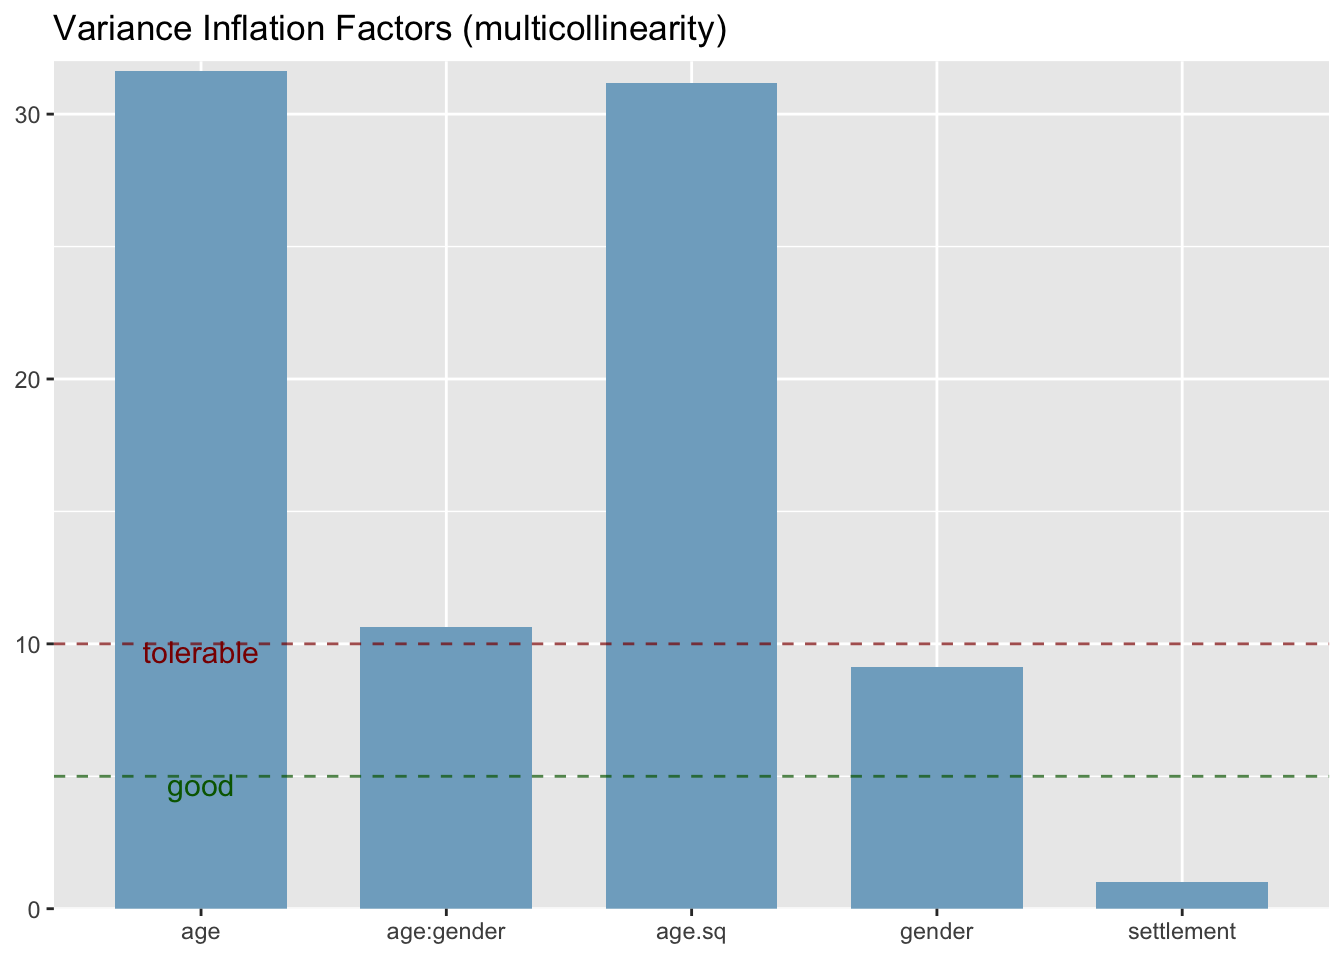
##
## [[2]]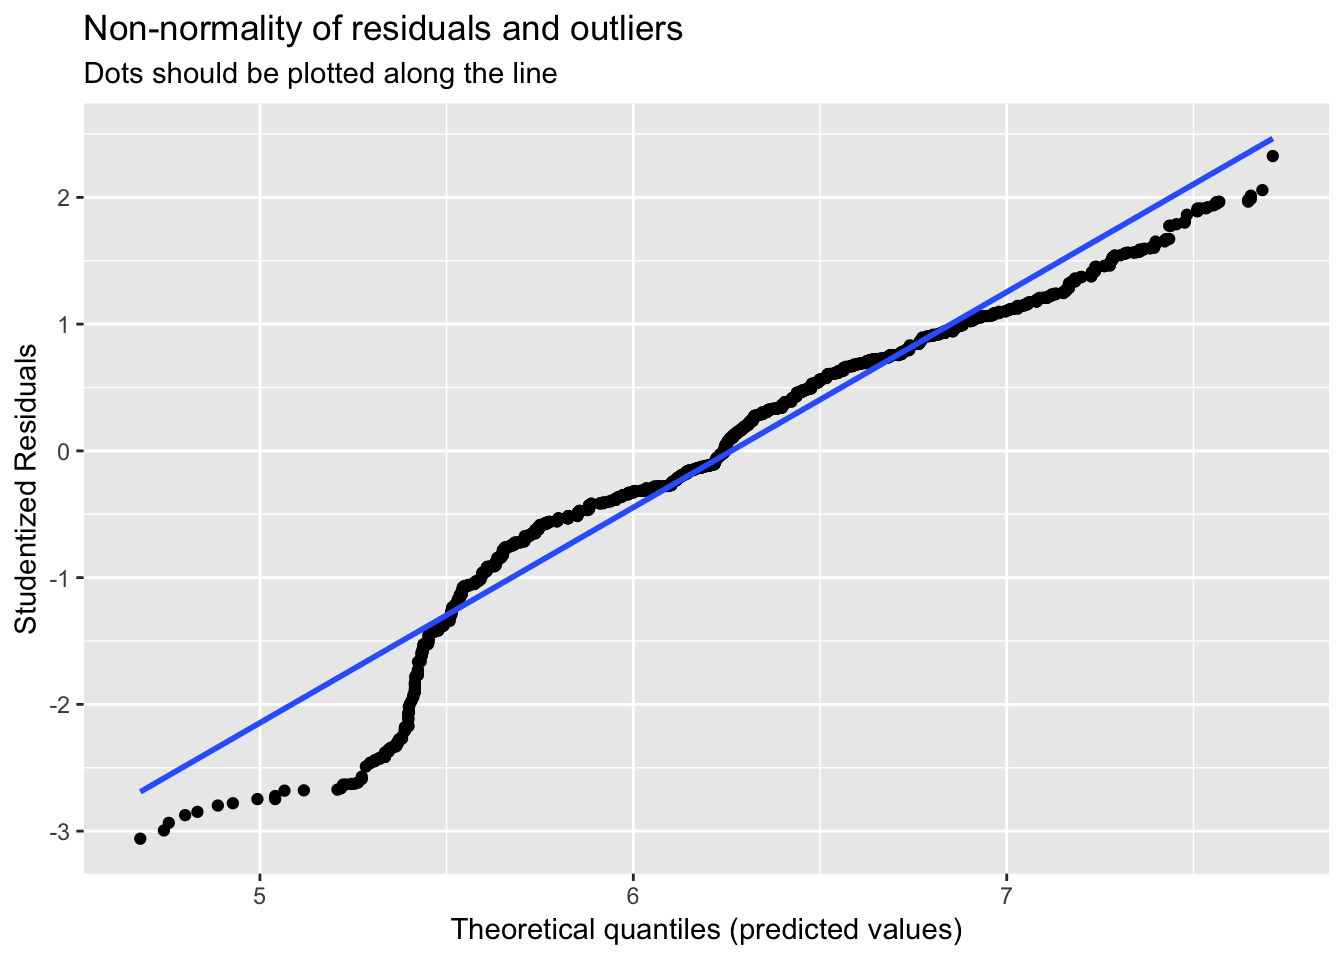
##
## [[3]]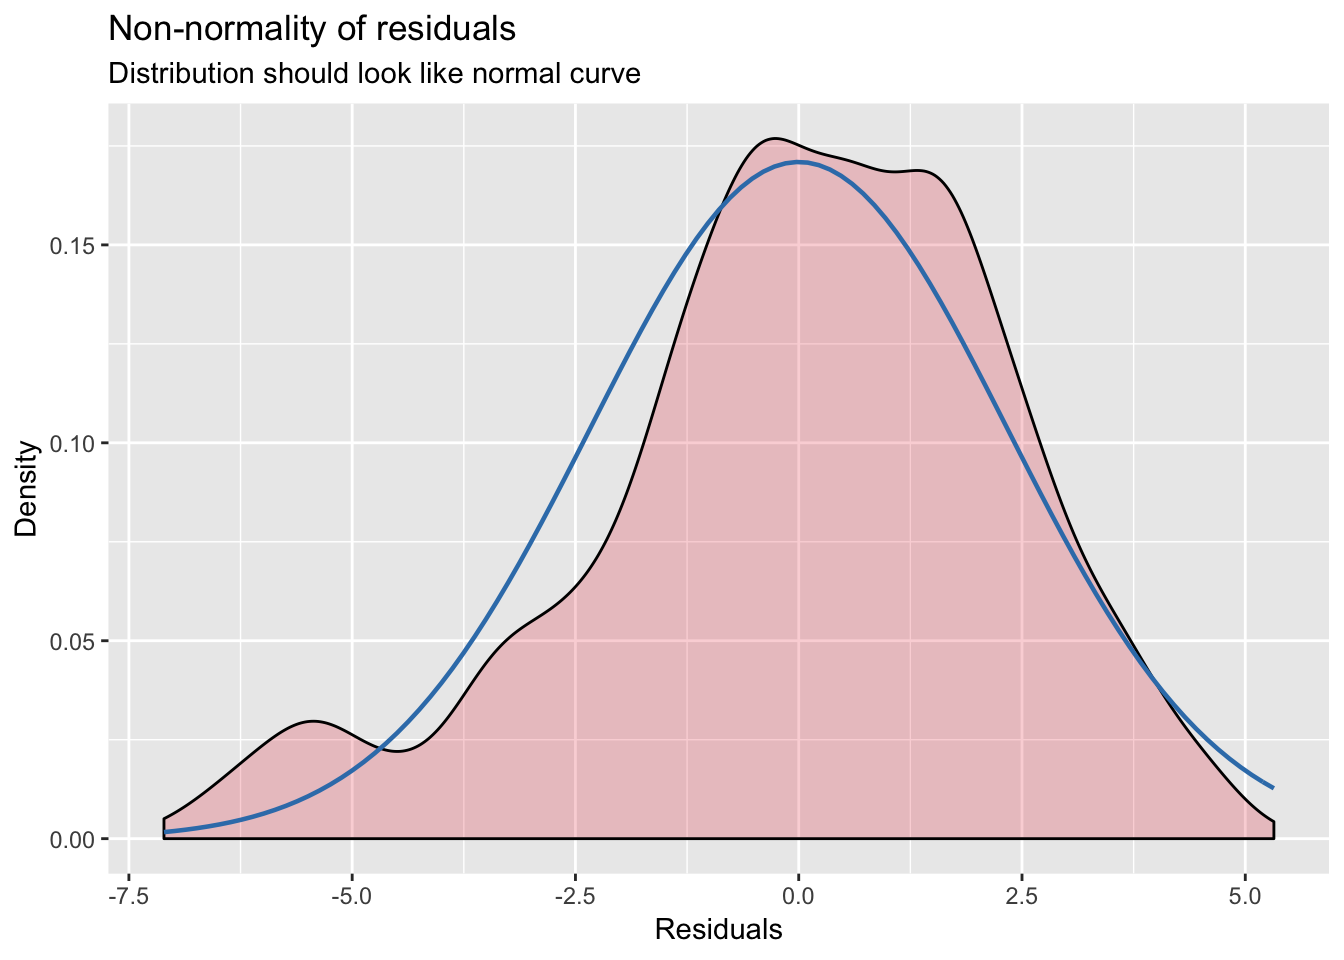
##
## [[4]]