
Overview
Maksim Rudnev
24/01/2019
🤓 What to expect?
⦿ Purpose of the seminar
- Understand the main principles of R coding.
- Get ready for studying R programming.
🙌 Why do you need R?
Competitive skill at the labour market
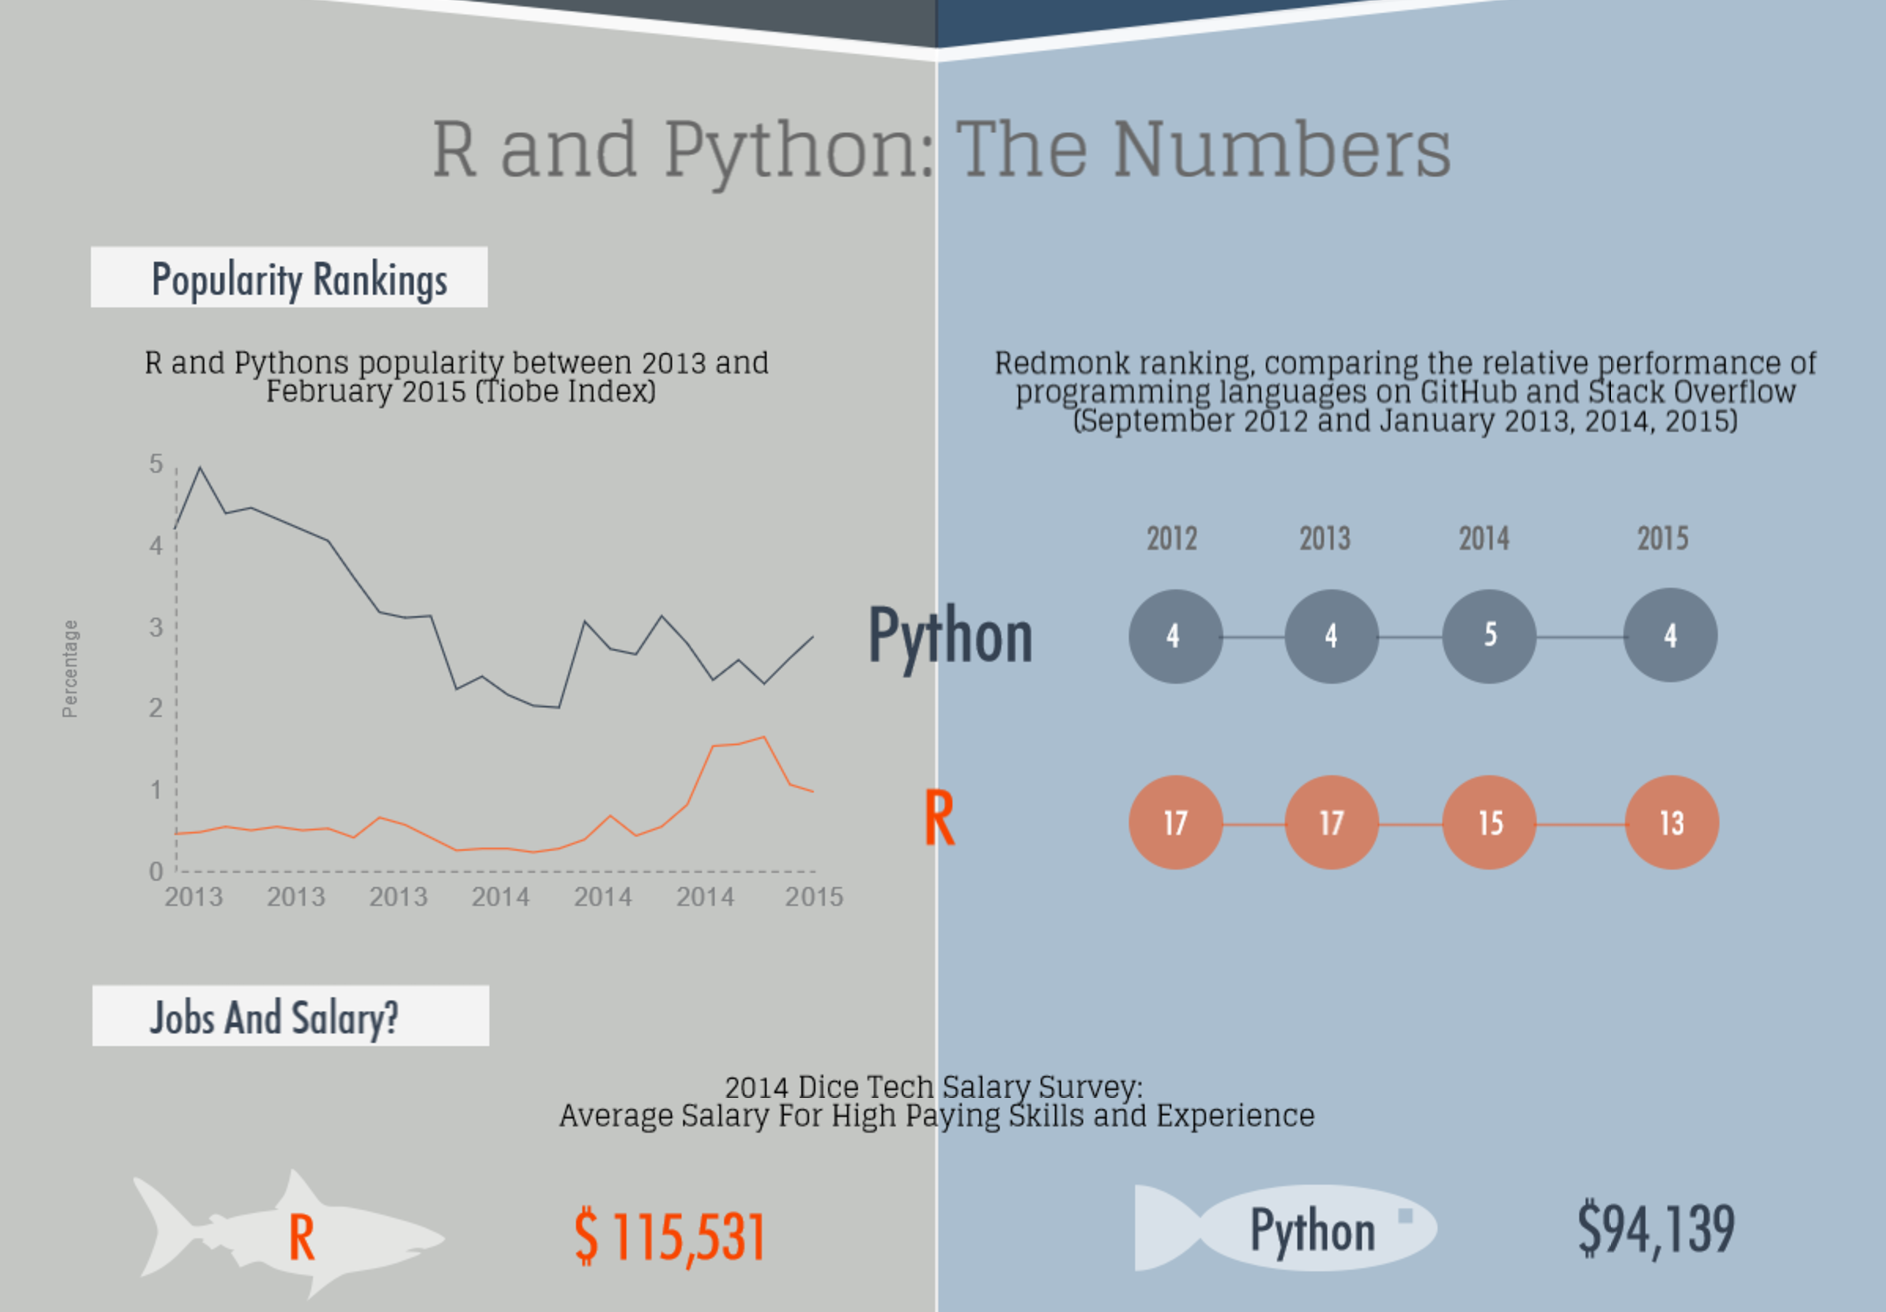 https://www.datacamp.com/community/tutorials/r-or-python-for-data-analysis
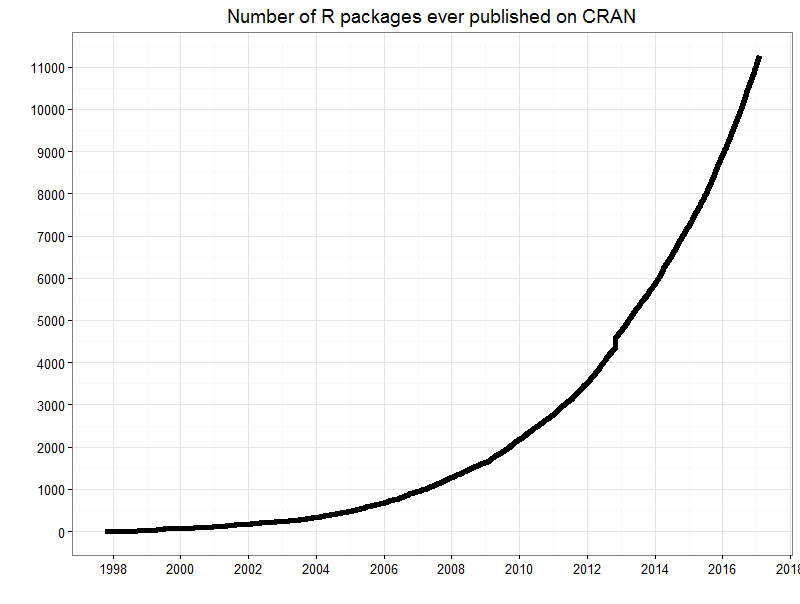
Huge variety of methods
- thousands of methods and procedures for quantitative and qualitative analysis;
- brand new and just published statistical methods are readily available.
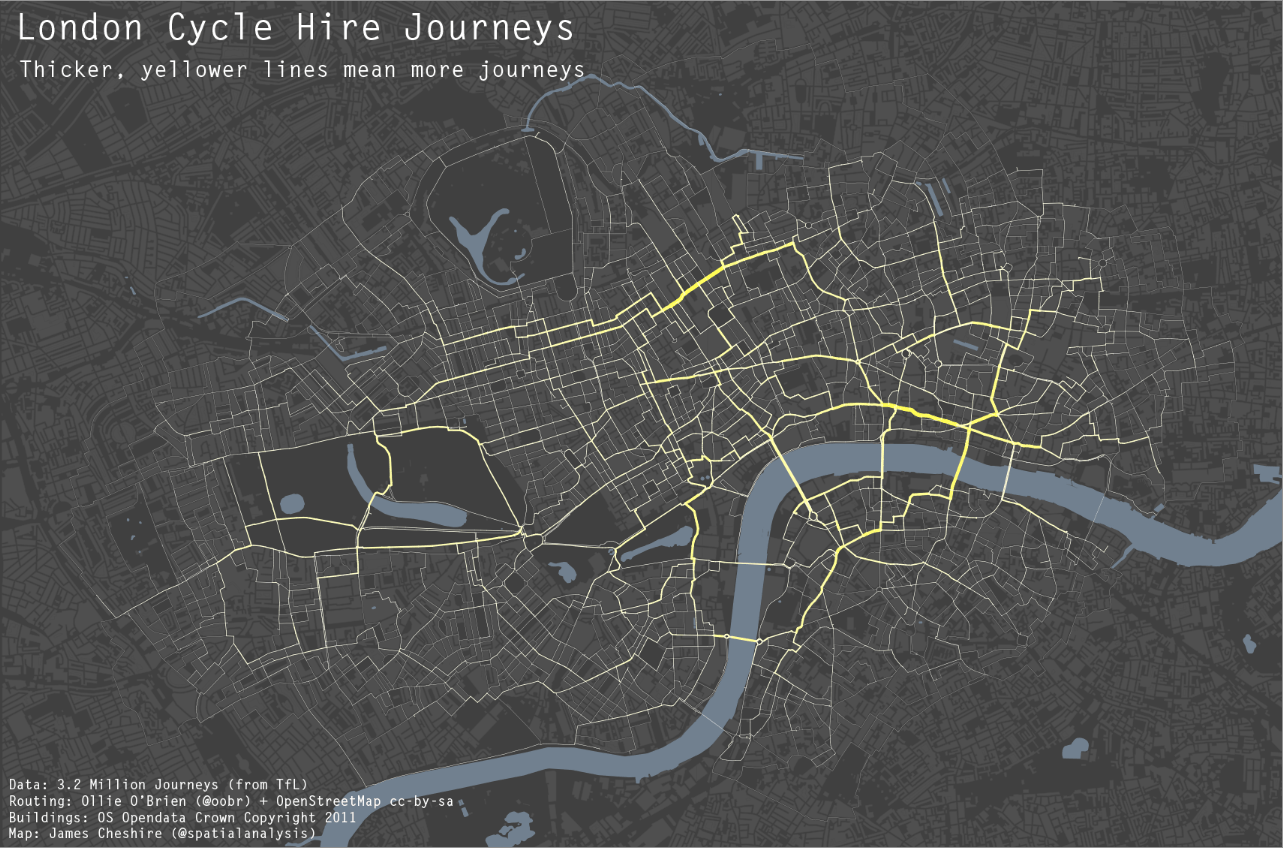
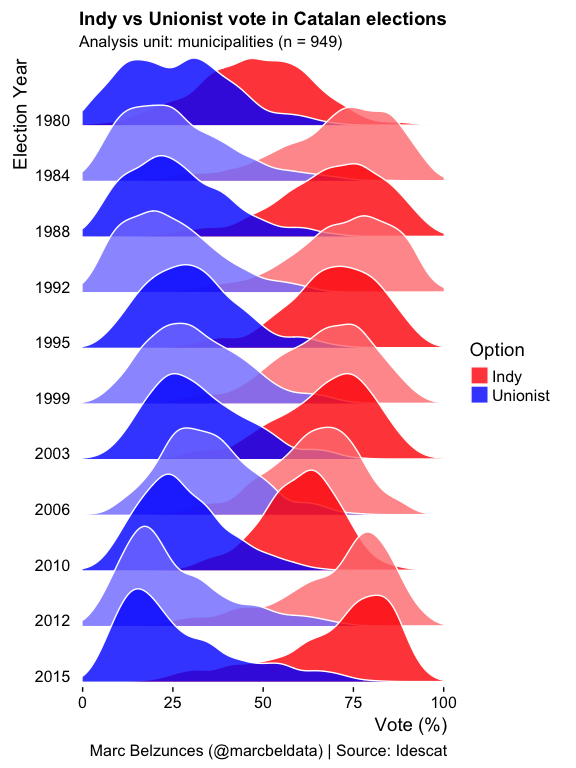
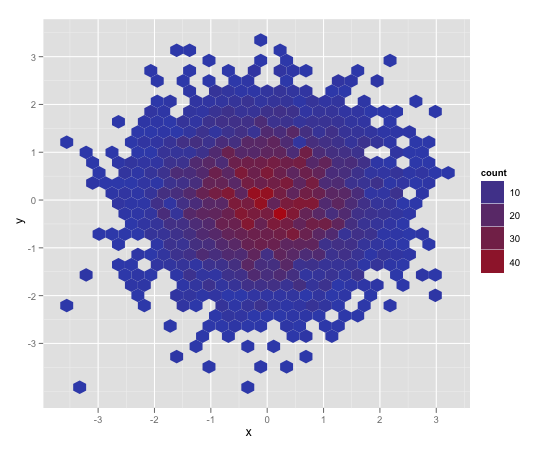
Data visualization
1
ggplot2
2
ggplot2
3
ggplot2
4
Can develop interactive apps for presentation of the research results
http://apps.maksimrudnev.com:3838/shiny_values/
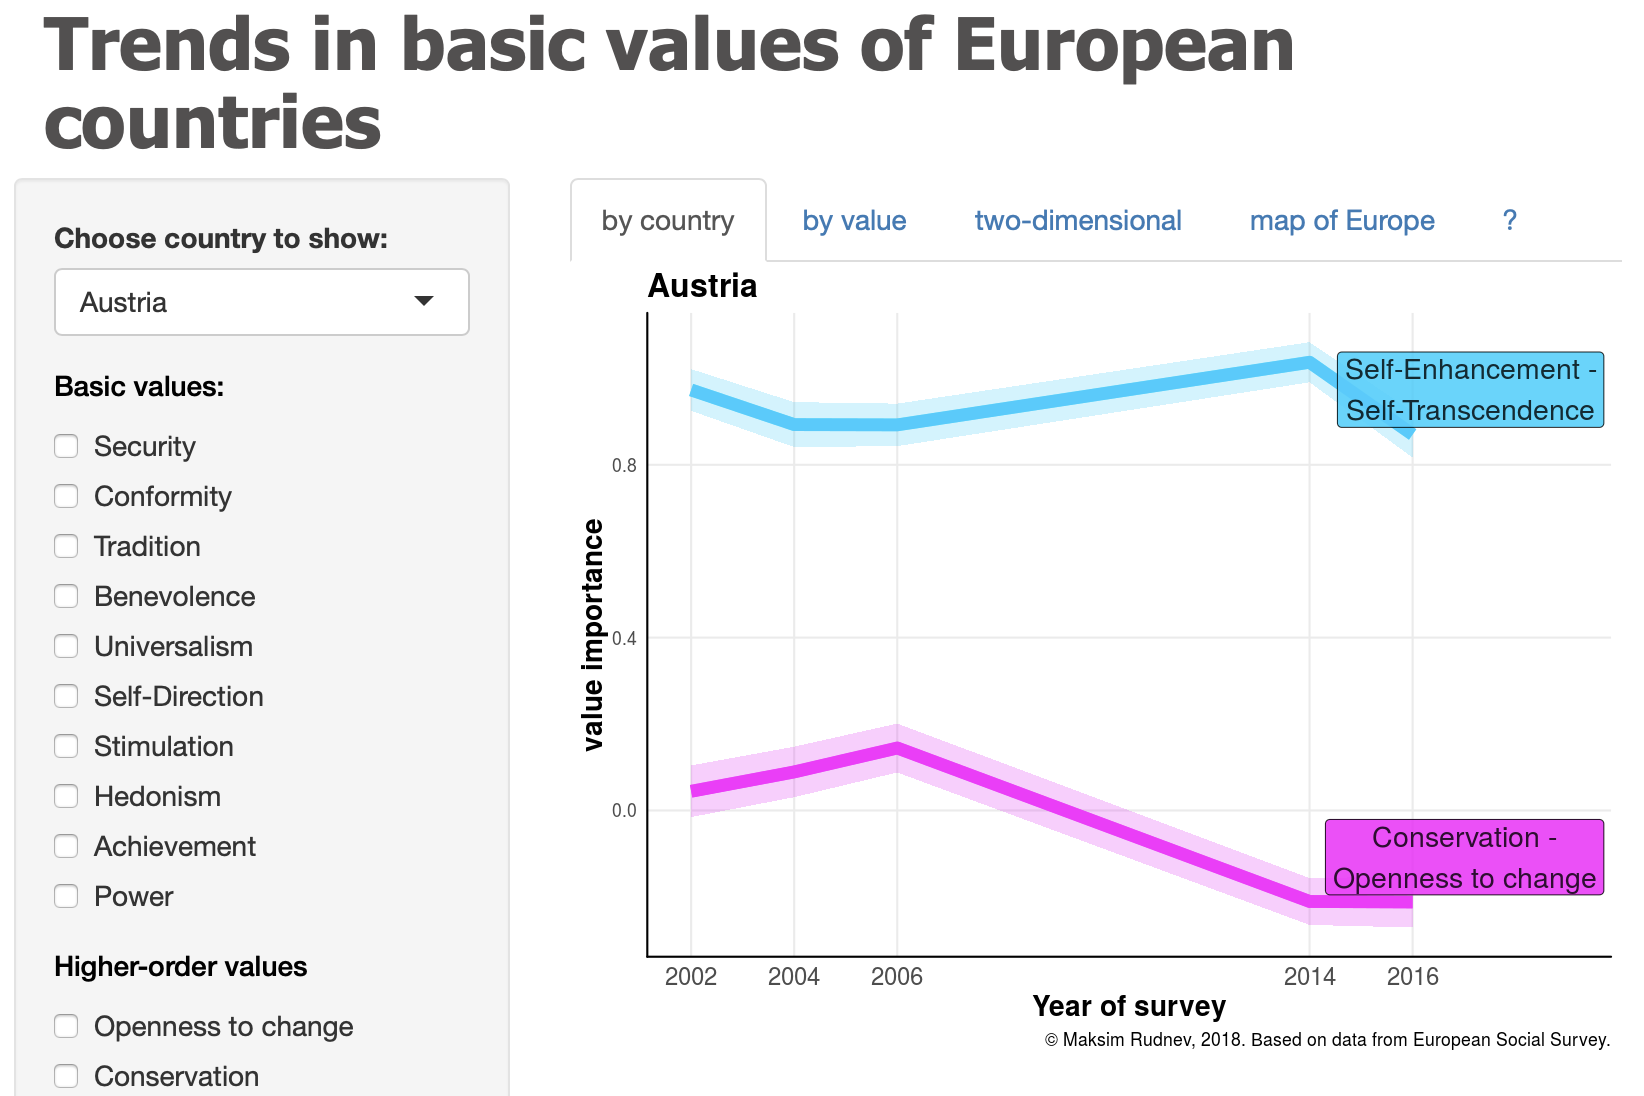
ggplot2+Shiny
Transparency and reproducibility
- Reproducibility - new opportunities to fulfill an old requirement of research falsifiability.
- Supply R codes with every study to enable others to reproduce your analysis / see what exactly you have been doing.
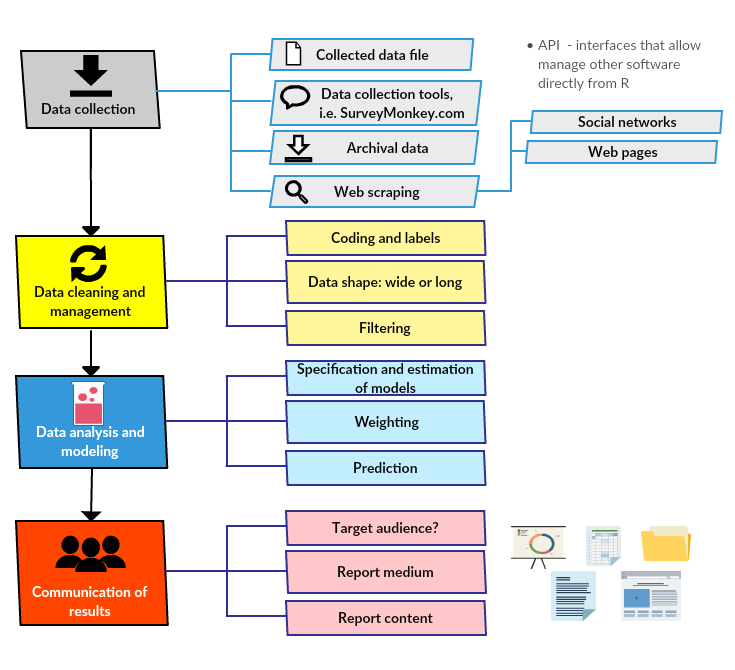
R can incorporate most stages of the psychological study. Most of these stages can be automated, and communicated to other researchers/co-workers.
What else can R do?
- all the basic statistics (everything SPSS can)
- factor, cluster, latent class analysis, multidimensional scaling
- regressions, ANOVA, MANOVA, etc.
- Social network analysis
- Machine learning, neural networks
- Time series analysis
- Text rendering, modification, search, classification
- Geographic and spatial data analysis
- Images, recognition and classification
- Interactive apps
- Automated reports
- Very convenient in routine and repeated analyses/manipulations
- Simulations.
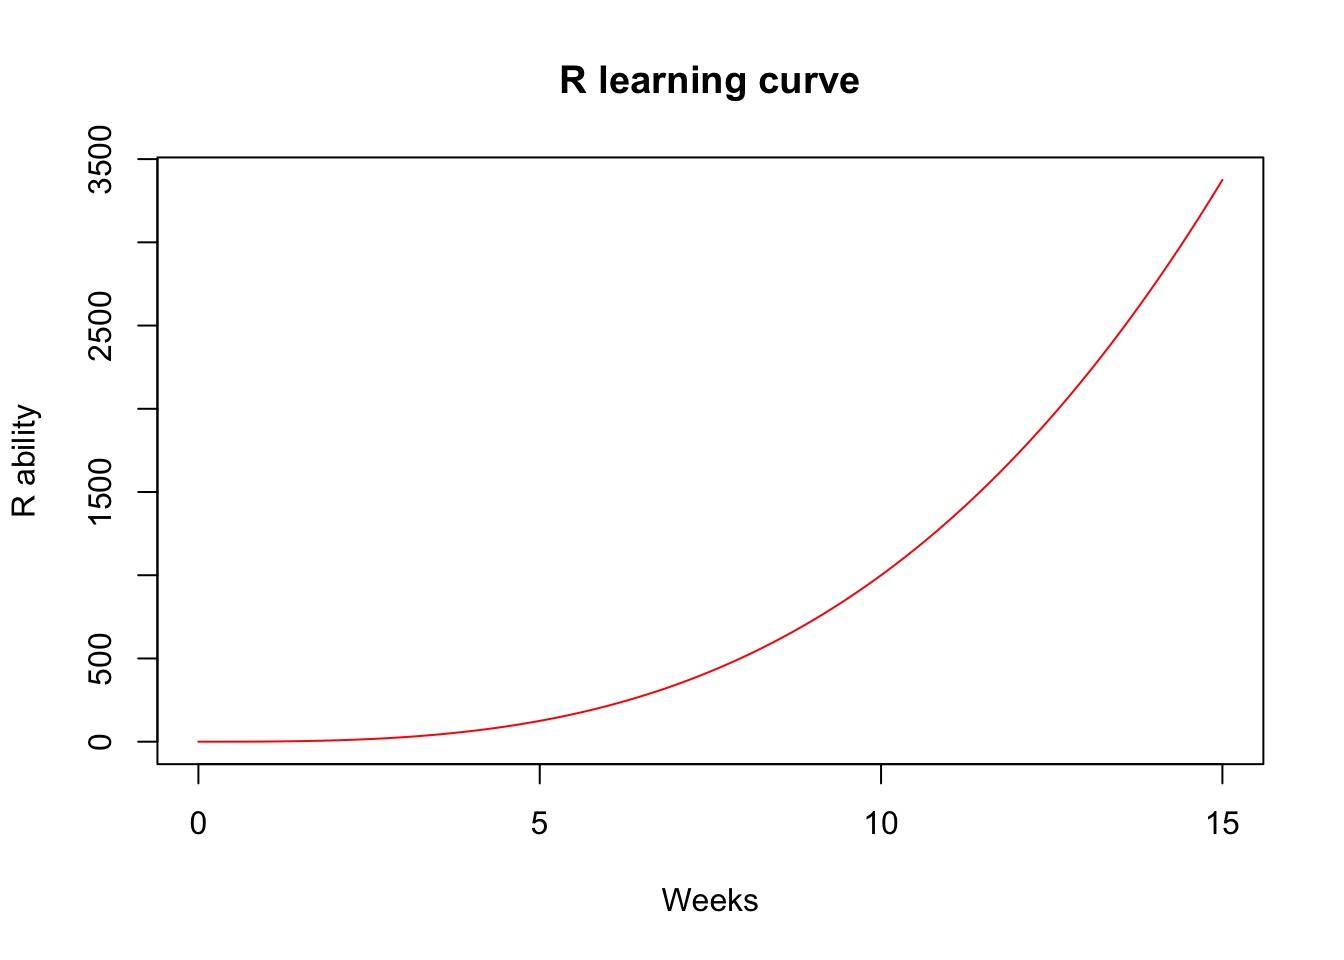
🤪 How is it going to be?
 curve(                      # R function name
   expr = x^3,                 # math expression of the curved line
   col = "red",                # line color
   xlim = c(0,15),           # range of values at х-axis
   xlab = "Weeks",             # name of X axis
   ylab = "R ability",         # name of Y axis
   main = "R learning curve"   # main title
   )
ℹ️ Sources and literature
a) Advice
- use online sources, becuase they are updated more often
- https://StackOverflow.com
- https://StackExchange.com
- https://StackOverflow.com: for specific programming problems;
- https://СrossValidated.com: for specific statistical problems;
- R documentation: Help or website https://www.rdocumentation.org/
b) Handbooks
- Intro from one of the key R developers: ❗️ R for Data Science by Garrett Grolemund, Hadley Wickham free
- Rob Kabakoff, R in Action, 2nd edition and accompanying website Quick R
Graphics in R:
- R Graphics Cookbook by Winston Chang и accompanying website
- Wickham, H. (2009). ggplot2: elegant graphics for data analysis. Springer Science & Business Media. - advanced graphics.
- DataCamp course - https://www.datacamp.com/courses/data-visualization-with-ggplot2-1
c) Free online courses
- DataCamp.com - https://www.datacamp.com/onboarding/learn?technology=r
- coursera.org - https://www.coursera.org/learn/r-programming
- edx.org - https://www.edx.org/course/r-basics-2
🔄 Communication
- during
and afterthe seminar: Maksim.Rudnev@gmail.com - web https://maksimrudnev.com/iscte2019
?Questions?
🐑 | 🐕 | 🐈 | 🐌 | 🐸 |
🔦
♨︎