
Lecture 1. Basic stats recap. Exploratory factor analysis
💫 Recap of basics
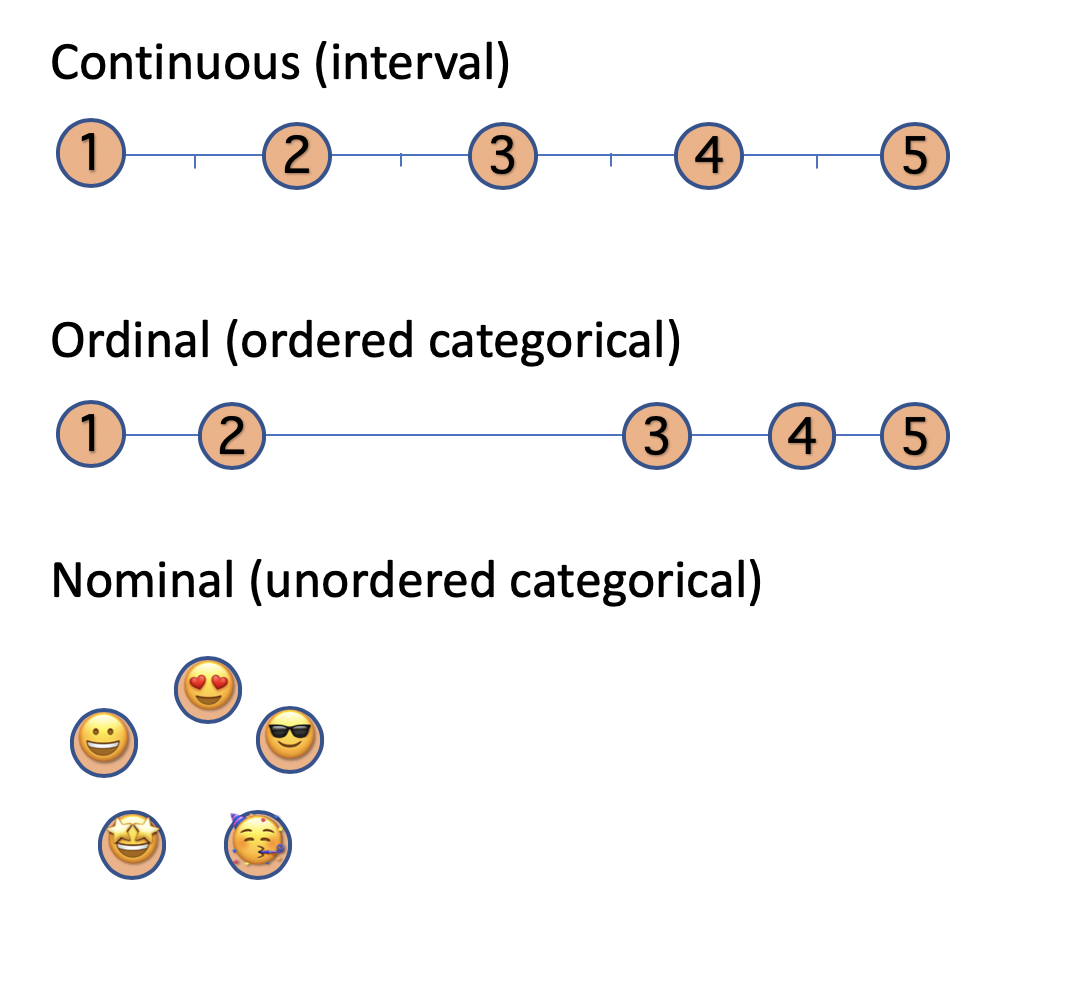
Scale types
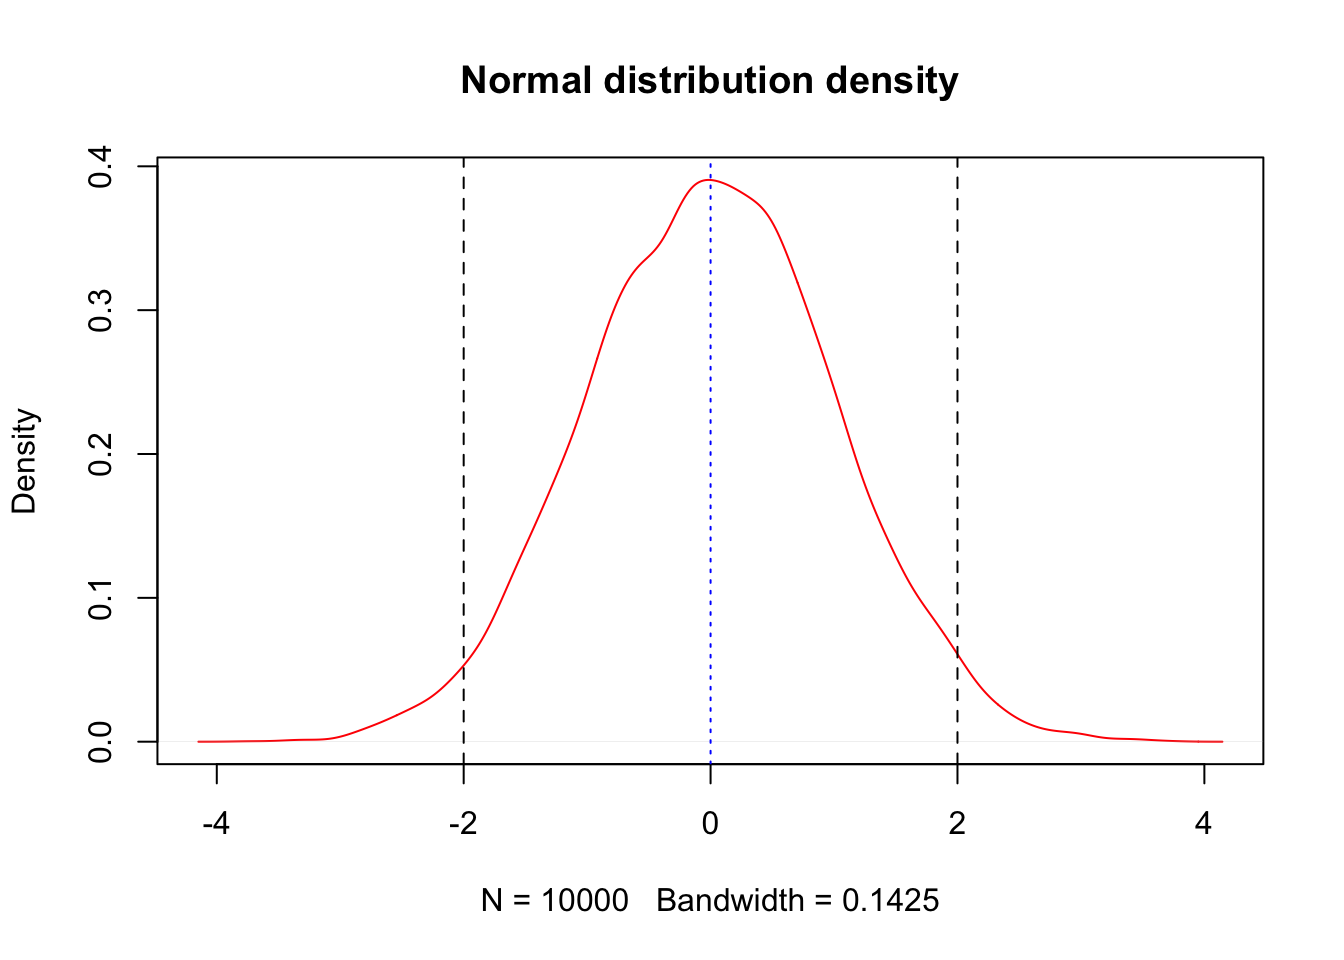
Normal standard distribution
- Mean = just average. Sum divided by number of cases.
- Covariance = average of squared differences between two variables.
- Sample variance = average of squared differences between mean and each real value.
- Standard deviation = square root of variance.
- Correlation (Pearson’s) = standardized covariance, i.e. covariance divided by a product of standard deviations.
- Regression coefficient in pairwise regression = covariance divided by variance of dependent variable.
🔢 Example - Excercise
We have data on age and Conservatism on a 10-point scale:
Compute mean, variance, standard deviation, variance, covariance, correlation, and regression coefficients using the formulas above.
Answers
| Conservatism.Mean | 6.20 |
| Conservatism.Sum.of.Squares | 10.80 |
| Conservatism.Variance | 2.70 |
| Conservatism.Stand.Deviation | 1.64 |
| Age.Mean | 14.00 |
| Age.Sum.of.Squares | 14.00 |
| Age.Variance | 3.50 |
| Age.Stand.Deviation | 1.87 |
| Covariance | 2.75 |
| Correlation | 0.89 |
| Regression.coefficient | 0.79 |
Stats for non-continuous variables
Can we use means and standard deviations to describe ordinal variables? (e.g. education level on the scale: primary school, secondary school, high school, college, bachelor’s, master’s, doctoral degrees).
Name some!
- median;
- interquartile range;
- median absolute deviation;
- chi-square test for contingency tables;
- Spearman’s or Kendall’s correlation;
- logistic regression.
📈 Linear Regression
http://setosa.io/ev/ordinary-least-squares-regression/
Pairwise regression
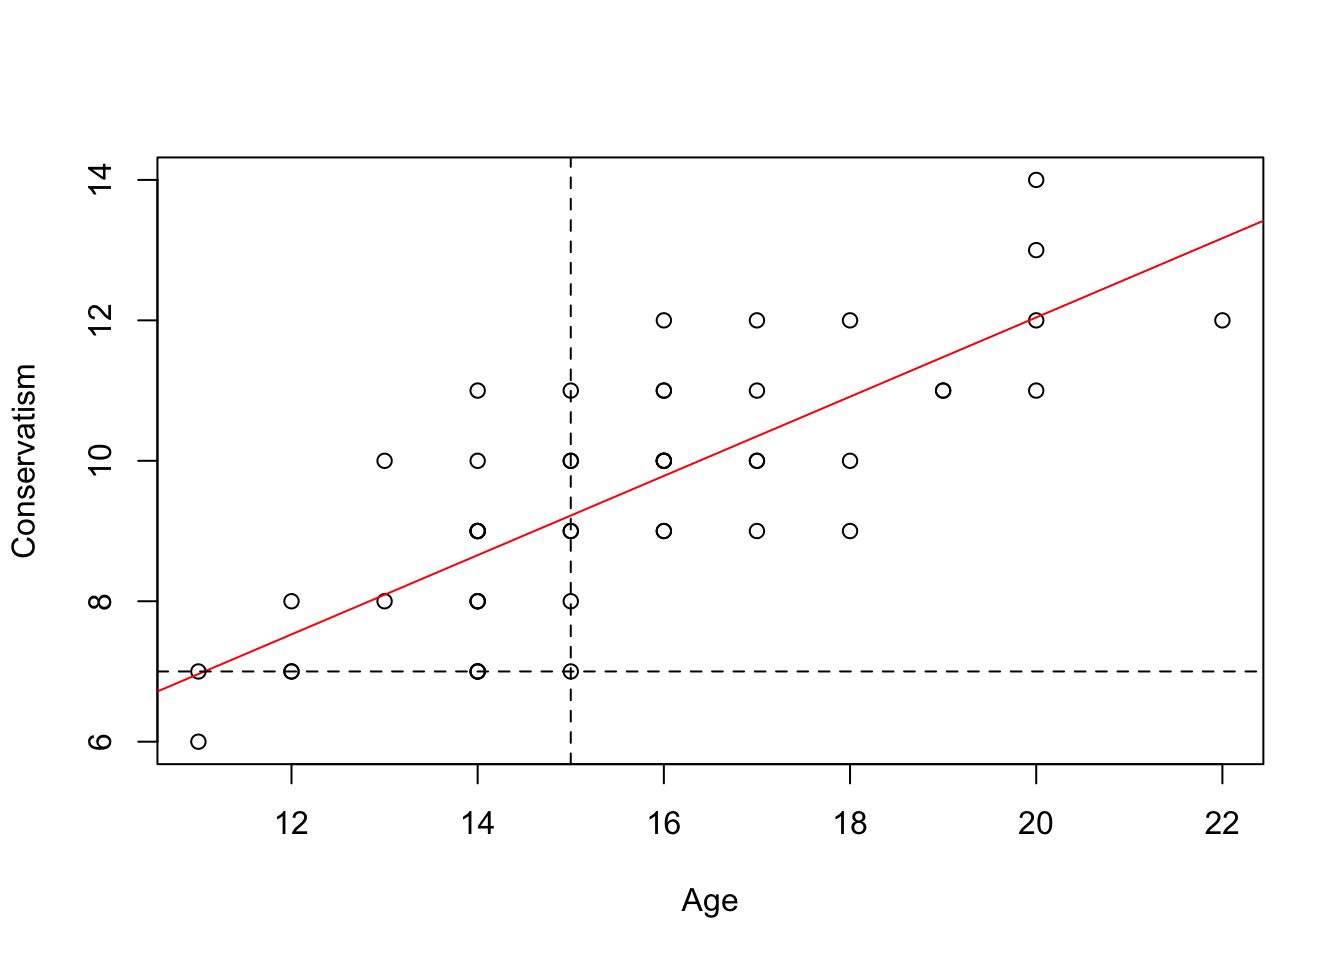
\[ Conservatism = a + b*Age + \epsilon, \]
where
- \(a\) - is intercept; (=-0.14)
- \(b\) - unstandardized regression coefficient, or ‘effect’ of age on Conservatism using the original metric (=0.27)
- \(\epsilon\) - variance of residuals (=2.37).
Diagram
\[ Conservatism = a + b*Age + \epsilon, \]
Diagram notation
Nodes
Edges
❗️The lack of connection between nodes implies absence of relations, orMultiple regression
\[ y = a + b_1Age + b_2Gender + b_3Tradition + \epsilon \]
Introducing a latent variable
What if Tradition values can not be observed directly and we can only see their manifestations, for example on Conservatism? We can still measure it!
The simplest
The realistic factor model
☑️ Task
Using these equations, draw a diagram of the corresponding CFA:
\[ insomnia = 7 + 0.8*depression + \epsilon(0.11)\\ appetite = 6 - 0.4*depression+ \epsilon(0.22)\\ sociability = 3 - 0.5*depression+ \epsilon(0.33) \\ senslessness = 2 + 0.4*depression+ \epsilon(0.44) \\ bad.mood = 2 + 1*depression+ \epsilon(0.55) \]
Answer