
Practice 2. Confirmatory factor analysis - updated
Demonstration of CFA in JASP
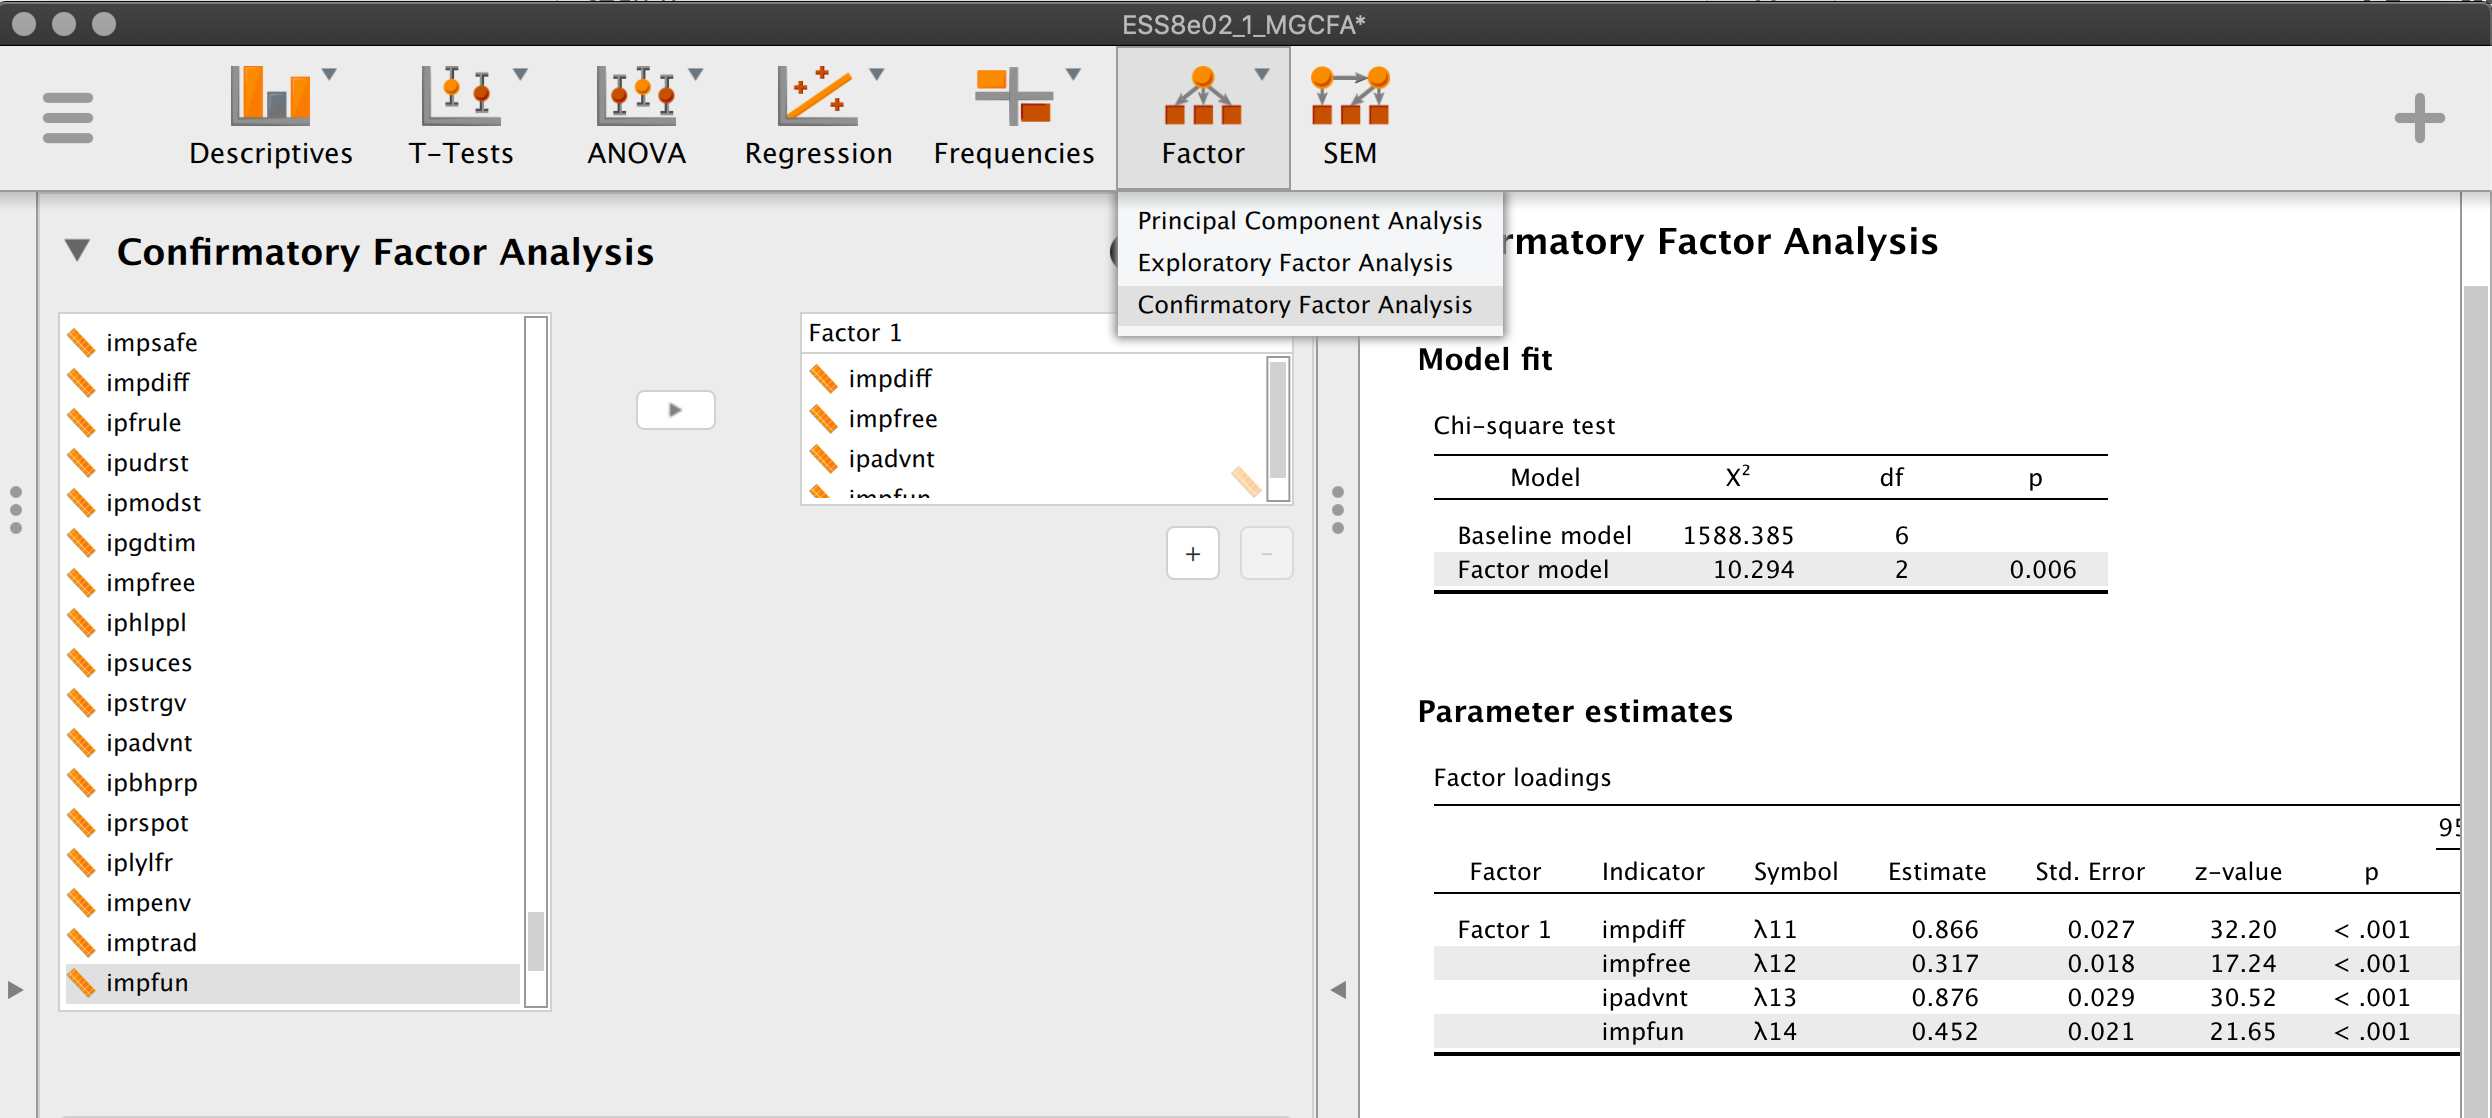
1. Specify an initial CFA model
- Filter the same ESS8 trimmed data so that there are only one country: Netherlands
- Run CFA analysis using variables below.
| Openness factor | |
impfun |
Important to seek fun and things that give pleasure |
impdiff |
Important to try new and different things in life |
impfree |
Important to make own decisions and be free |
ipadvnt |
Important to seek adventures and have an exciting life |
ipcrtiv |
Important to think new ideas and being creative |
| Conservation factor | |
ipfrule |
Important to do what is told and follow rules |
ipmodst |
Important to be humble and modest, not draw attention |
imptrad |
Important to follow traditions and customs |
ipstrgv |
Important that government is strong and ensures safety |
- Add the diagram (model plot), make sure the model is what you intended.
- In Model Options - check the way the model is identified. Change it and look how it affected the results. Did the fit measures change?
- Add the Mean Structure and check how it affected the results. HAve the fit measures changed?
2. Identify misfit
- Check the fit statistics - are they ok? Enable Additional Output -> Additional fit measures. Check the CFI, RMSEA, SRMR. Are they all fine?
- Try to detect the source of misspecification, using Modification indices and residuals matrix (or Misfit Plot).
- Name the model something like “Initial CFA”. Copy the results to Word.
3. Modify the model
- Begin another CFA analysis in JASP.
- Specify the changed model structure following the detected misfit. All changes should also make sense theoretically.
- Add the diagram (model plot), make sure the model is what you intended.
- Add the note explaining the change in the model structure. Change the model name so that it makes sense, e.g. “Two-factor model with 1 residual covariance”.
- Compare this model’s fit to the fit of the previous model - has it improved?
- Check the fit statistics - are they ok?
- If yes, move to step 4.
- If not, identify the misfit (back to Step 2). Make sure you don’t add too many parameters to avoid overfitting problem.
4. Examine the parameter estimates
Check if all the coefficients make sense:
- all the factor loadings are significant
- all the factor loadings have an expected sign;
- all the variances and residuals have positive values;
5. Report
- Copy the outputs of all the models to Word,
- Combine the model fit into a single table,
- Remove all the parameter estimates except the ones from the last [final] model,
- Keep the diagram.
- Optional. Write a short description of the steps you undertook.
- Make a conclusion: is this a good measurement model?